
Evaluation of Express Entry: Early
Impacts on Economic Outcomes
and System Management
Research and Evaluation Branch
May 2020

For information about other Immigration, Refugees and Citizenship Canada (IRCC) publications,
visit: www.cic.gc.ca/publications.
Available in alternative formats upon request.
Également disponible en français sous le titre : Évaluation du système Entrée express : impacts
préliminaires sur les résultats économiques et la gestion du système
Visit us online
Immigration Refugees and Citizenship Canada at www.cic.gc.ca
Facebook at www.facebook.com/CitCanada
YouTube at www.youtube.com/CitImmCanada
Twitter at @CitImmCanada
© Her Majesty the Queen in Right of Canada, represented by the Minister of Immigration,
Refugees and Citizenship, 2019
Ci4-210/2020E-PDF
978-0-660-35508-5
Project reference number: E3-2019

- 3 -
Table of contents
Executive summary 6
Evaluation of Express Entry: Impacts on Economic Outcomes and System Management.
Management Response Action Plan (MRAP) 9
1. Introduction 14
1.1. Purpose of evaluation 14
1.2. Brief Express Entry profile 14
1.2.1. The Comprehensive Ranking System 15
1.2.2. Economic programs covered under Express Entry 16
1.2.3. Characteristics of Express Entry immigrants admitted to Canada between 2015 and 2018 17
2. Methodology 21
2.1. Questions and scope 21
2.2. Data collection methods 21
2.3. Limitations and considerations 23
3. Early economic results 24
3.1. Labour market participation 24
3.2. Job history 25
3.2.1. First job after obtaining permanent residence 25
3.2.2. Job at time of survey 27
3.2.3. Professional advancement 28
3.3. Average employment income 29
3.3.1. Employment income 29
3.3.2. Effectiveness of the Comprehensive Ranking System 30
3.4. Labour market outcomes of Express Entry spouses 33
4. Responsiveness of Express Entry to labour market needs 34
4.1. Finding jobs quickly and pre-arranged offer of employment 34
4.2. Employers’ needs and experience with the Express Entry system 34
4.2.1. Employers’ needs 34
4.2.2. Employers’ experience with Express Entry system 35
5. Impact of Express Entry on profile of admissions under the economic programs 36
5.1. Profiles of economic immigrants admitted – 2015 to 2018 36
5.2. Impact on economic programs’ admission profiles 37
6. Other Express Entry outcomes 39
6.1. Contribution to official language minority communities 39
6.2. Impact of Express Entry on gender 40
6.2.1. Gender-based socio-demographic profile 40
6.2.2. Gender-based economic outcomes 41
6.3. Impact of Express Entry on efficiency, flexibility and integrity 43
6.3.1. Efficiency 43
6.3.2. Flexibility 46
6.3.3. Integrity 47
7 Conclusions and recommendations 49
Appendix A: The Comprehensive ranking system 51
Appendix B: Socio-demographic profiles 56
Appendix C: Evaluation matrix for the evaluation of IRCC’s Express Entry system 62
Appendix D: Regression results on employment income 66
Appendix E: Employer survey respondent profile 78
Appendix F: Regression results on employment income by gender 79
Appendix G: Case studies 84

- 4 -
List of tables
Table 1: Occupation types in which Express Entry and non-Express Entry respondents are employed at
time of first job after obtaining permanent residence 26
Table 2: Top 10 occupations in which Express Entry and non-Express Entry respondents were employed at
time of first job after obtaining permanent residence 27
Table 3: Socio-demographic profile of economic principal applicants* by immigration regime 36
Table 4: Occupation and quality of employment survey results for express entry and non-express entry
male and female respondents 42
Table 5: Historical processing time (in months) for 80% of cases 43
Table 6: Processing times of Express Entry applications (2015-2018) in months 44
Table 7: Permanent resident processing inventory (2009–2014) 44
Table 8: Permanent resident processing inventory (2015–2018) 44
Table 9: Refusal rates (2014–2018) 45
Table 10: Comprehensive ranking system— Core Human Capital factors (with spouse maximum 460;
without spouse maximum 500 – for all factors) 51
Table 11: Comprehensive ranking system—Spouse factors (maximum 40) 53
Table 12: Comprehensive ranking system skill—Transferability factors (maximum 100) 54
Table 13: Comprehensive ranking system—Additional points 55
Table 14: Non-express entry principal applicants and admissions 56
Table 15: Express Entry principal applicants and admissions 59
Table 16: Linear regression for the log of employment income in 2017 for Express Entry and non-Express
Entry principal applicants – 2015 and 2016 cohorts, model 1 66
Table 17: Linear regression for the log of employment income in 2017 for Express Entry and non-Express
Entry principal applicants – 2015 and 2016 cohorts, model 2 66
Table 18: Linear regression for the log of employment income in 2017 for Express Entry and non-Express
Entry principal applicants by immigration program – 2015 and 2016 cohorts 69
Table 19: Linear regression for the log of employment income in 2017 for Express Entry principal applicants
– 2015 and 2016 cohorts 71
Table 20: Analysis of the unique contribution of predictors to the R-Square 74
Table 21: Linear regression for the log of employment income at time of survey for Express Entry principal
applicants – 2015 to 2018 cohorts 75
Table 22: Linear regression for the log of employment income in 2017 for Express Entry and non-Express
Entry principal applicants by gender – 2015 and 2016 cohorts 79
Table 23: Linear regression for the log of employment income in 2017 for Express Entry principal applicants
by gender – 2015 and 2016 cohorts 81
Table 24: Labour market outlook and Express Entry principal applicant admissions – selected occupations 84
List of figures
Figure 1: Incidence of employment income one year after admission by immigration categories, 2015 and
2016 admissions 25
Figure 2: Average employment income one year after admission by immigration categories, 2015 and 2016
admissions 29
Figure 3: Incidence of employment income (a) and average employment income (b) for Express Entry and
non-Express Entry spouses 33
Figure 4: Incidence of employment income (a) and average employment income (b) for express entry and
non-express entry male and female principal applicants 41

- 5 -
List of acronyms
CEC Canadian Experience Class
CLB Canadian Language Benchmark
CMM Cost Management Model
CRS Comprehensive Ranking System
EE Express Entry
FPT Federal-Provincial-Territorial
FSTP Federal Skilled Trades Program
FSW Federal Skilled Worker
FSWP Federal Skilled Worker Program
GCMS Global Case Management System
IMDB Longitudinal Immigration Database
IRCC Immigration, Refugees and Citizenship Canada
IRPA Immigration and Refugee Protection Act
IRPR Immigration and Refugee Protection Regulations
NOC National Occupation Codes
OLMC Official Language Minority Communities
PA Principal Applicant
PNP Provincial Nominee Program
PR Permanent Resident
TR Temporary Resident

- 6 -
Executive summary
This report presents the findings of the evaluation of Immigration, Refugees and Citizenship
Canada’s (IRCC) Express Entry system. The evaluation was conducted in fulfillment of
requirements under the 2016 Treasury Board Policy on Results, and considered issues of the
system’s effectiveness, with particular attention given to the early economic performance of
immigrants screened through Express Entry. The evaluation covered the period from 2015 to
2018.
Overview of the Express Entry system
Launched in January 2015, Express Entry is Canada’s evidence-based application management
system for certain economic immigration categories: Federal Skilled Worker Program, Federal
Skilled Trades Program, Canadian Experience Class and a portion of the Provincial Nominee
Program.
Express Entry was designed with three main objectives in mind: 1) flexibility in selection and
application management; 2) responsiveness to labour market and regional needs; and 3) speed in
application processing. Express Entry uses the Comprehensive Ranking System, which is an
evidence-based points system designed to identify candidates most likely to achieve high
employment earnings and who are able to maximize their economic performance in the Canadian
labour market. Therefore, the main focus of the evaluation was to assess the early economic
outcomes of economic principal applicants screened in using Express Entry.
Summary of conclusions and recommendations
Overall, findings from the evaluation show that early economic results for Express Entry
principal applicants are positive – they are demonstrating high levels of labour market
participation and solid results in terms of their employment income, as well as the type of
occupation in which they are employed.
Further, the evaluation found that Express Entry principal applicants generally outperform their
non-Express Entry counterparts. In particular, these early results show that 95% of Express Entry
principal applicants have become established economically and incidence of employment is high
across the four immigration categories. Of those who were working:
• 83% reported doing so in their primary occupation;
• Express Entry principal applicants earned 20% more than non-Express Entry principal
applicants; and
• 43% of Express Entry principal applicants were in occupations usually requiring university
education (NOC A) for their first job as permanent resident compared to 25% for non-Express
Entry principal applicants.
While early economic results were generally positive, it should be noted that the EE system was
designed to screen high human capital candidates who have the potential to achieve economic
success in the Canadian labour market over the longer term. Nevertheless, the early results are
encouraging and suggest that candidates screened through Express Entry are becoming
economically established with high employment rates and employment income.
Based on the evaluation findings and in support of the continued success of the Express Entry
system, the following four recommendations are proposed:

- 7 -
Monitoring of the system
The evaluation found Express Entry to be an effective screening mechanism to screen candidates
with higher potential for economic integration in Canada. While the CRS was designed to
identify those with potential for economic integration, including over the longer term, the
evaluation looked only at predictors of success in the first few years since implementation.
Specifically, while the evaluation found certain elements of the CRS had a significant impact on
short-term earnings (e.g., knowledge of the first official language), it also found that other
elements of the CRS had a limited impact on short-term economic outcomes of EE PAs.
Particularly, the skills transferability factors and spouse factors in the CRS were not found to
have clear impact on short-term economic outcomes. These findings point at the need to continue
monitoring the capacity of the CRS to identify EE PAs who will have positive economic
outcomes in the longer-term.
Recommendation 1: IRCC should continue to monitor the impact of the CRS on
earnings in the longer term, revalidating and streamlining it as needed, to focus on key
predictors of economic success.
Information gaps
The evaluation found that there were certain gaps in the information provided by candidates
when applying for permanent residence. In particular, while level of education is considered a
key human capital characteristic, it is not a mandatory field in the electronic application and, as a
result, not all candidates invited to apply for permanent residence submit information on their
educational credentials. The lack of this type of data limits the Department’s ability to fully
assess the impact of level of education on economic results. Collecting information on level of
education for all economic immigrants, including spouses and dependents, will allow IRCC to
monitor and more reliably measure the impact of education on the economic results of PAs
screened in through EE.
Recommendation 2: IRCC should collect information on the level of education of all
principal applicants, as well as information related to their spouses.
Management of integrity
At the launch of Express Entry, tools were introduced to improve capacity to detect potential
fraud and manage system risk. However, the Express Entry Validation and Verification Process
(VVP), which was intended to be a central integrity mechanism, was discontinued due to capacity
issues and lack of coordination. And with diffuse roles and responsibilities relating to the
integrity of the Express Entry system, the departmental approach has relied on officer experience
and minimal centralized oversight as opposed to addressing integrity with a systematic approach
as originally intended. Given the potential for fraud as changes to both the Express Entry system
and the CRS are made and as economic immigration grows, there is a need for a more purposeful
approach to monitoring integrity and emerging risk areas.
Recommendation 3: IRCC should develop and implement a systematic approach to
manage integrity in Express Entry.

- 8 -
Electronic system inefficiencies
Express Entry’s implementation as an electronic application system resulted in efficiencies in
application processing, though the electronic nature of the system introduced some challenges
associated with accessibility of client and application information. For example, clients are not
able to review their supporting documents once they have uploaded them and before submitting
to IRCC, rendering them unable to rectify any errors that may have been made, such as uploading
an incorrect document. In addition, it was noted that the system generates a new set of client
information each time a client updates their EE profile.
Such challenges have in turn led to complications related to litigation and ATIP management -
the complex nature of the electronic application system has made it difficult to produce evidence
when litigation occurs. Additionally, the electronic nature of the system makes it more difficult to
produce a Certified Tribunal Record for the court. With respect to ATIP, issues were identified
with the system’s technical design for extracting profile information. In addition, IRCC has
experienced an increased volumes of ATIP requests related to Express Entry applications, which
typically involves a large amount of documentation. These issues highlight an opportunity to
address certain inefficiencies in the electronic system for the benefit of clients and the
Department.
Recommendation 4: IRCC should develop and implement methods to:
− Allow Express Entry clients to view their application and uploaded documents prior
to, and after applying; and
− Improve accessibility of GCMS information to support the production of complete
records for operational, litigation and ATIP purposes.

- 9 -
Evaluation of Express Entry: Impacts on Economic Outcomes
and System Management. Management Response Action
Plan (MRAP)
The Express Entry system is an effective filtering mechanism, screening in individuals who have stronger
short-term economic performance in Canada compared to those not screened in through the system. And
while the evaluation found certain elements of the CRS had a significant impact on short-term earnings, it
also found that other elements of the CRS had a limited impact on short-term economic outcomes of EE
PAs. Particularly, the skills transferability factors and spouse factors were not found to have clear impact
on short-term economic outcomes. These findings suggest that IRCC should continue monitoring the
capacity of the CRS to identify EE PAs who will have positive economic outcomes in the longer-term.
Recommendation 1
IRCC should continue to monitor the impact of the CRS on earnings in the longer term,
revalidating and streamlining it as needed, to focus on key predictors of economic success.
Response
The CRS was designed to filter for candidates who are most likely to achieve high employment
earnings over the long term. This means that a full assessment of the CRS’s effectiveness would
only be feasible once earnings data for a cohort of immigrants sourced through Express Entry are
available for a ten-year period—i.e. in 2026, at the earliest.
IRCC recognizes the importance of ongoing monitoring of the CRS and of using that information
to recalibrate it as needed. The most robust data for this purpose would come from a continuing
linkage of IRCC Express Entry data with Statistics Canada’s Longitudinal Immigration Database,
contingent on funding and approval.
This linkage would allow IRCC to conduct analysis on a regular basis, as well as give academics
access to additional data to conduct their own research. The Department would benefit from that
research as well.
The original collaborative work between IRCC and Statistics Canada to develop the CRS focused
on the earnings of principal applicants that landed in 2004 or earlier. It is an appropriate time to
repeat this analysis with more recent data to see if the core human capital factors continue to
reliably predict long-term earnings as well as look at whether other outcomes and factors should
be incorporated. The results of the review would be presented to the DG Level Policy Committee.
This work will also help to inform future recommendations for potential adjustments to the CRS.
Actions
Action 1a: Develop a strategy to consistently link Express Entry data to Statistics Canada’s
Longitudinal Immigration Database (IMDB) on a regular basis to monitor the impact of the CRS
on earnings in the longer term.
− Accountability: Lead SPP. Support CDO, R&E, IB
− Completion date: Q4 2020–2021

- 10 -
Action 1b: Conduct a comprehensive review to revalidate the CRS based on more recent data,
and regularly every five years.
− Accountability: Lead SPPB. Support R&E, IB, CDO
− Completion date: Q1 2021–2022
Action 1c: Present results of review to Policy Committee, and regularly every five years.
− Accountability: Lead SPPB
− Completion date: Q3 2021–2022
The evaluation found that there were certain gaps in the information provided by candidates when
applying for permanent residence. In particular, while level of education is considered a key human capital
characteristic, it is not a mandatory field in the electronic application and, as a result, not all candidates
invited to apply for permanent residence applicants submit information on their educational credentials.
The lack of this type of data limits the Department’s ability to fully assess the impact of level of education
on economic results. Collecting information on level of education for all economic immigrants, including
spouses and dependents, will allow IRCC to monitor and more reliably measure the impact of education
on the economic results of PAs screened in through EE.
Recommendation 2
IRCC should collect information on the level of education of all principal applicants, as well as
information related to their spouses.
Response
IRCC agrees with this recommendation.
IRCC already collects information on Express Entry principal applicants’, their spouses’ and
dependants’ educational history over the last ten years through the electronic application for
Permanent Residence. Analysis is required to determine whether a reliable measure of level of
education could be derived from this existing information for Express Entry principal applicants
and their spouses or partners. If the assessment determines that this data is not sufficiently robust,
a set of recommendations to collect this information from principal applicants and their spouses
or partners will be developed, taking into account implications for clients, privacy, IT systems,
and costs.
In addition, IRCC is also in the process of implementing a systems change that would allow it to
collect information on the field of study of Express Entry candidates. Such a list is essential for
conducting research on the impact of study experience on economic outcomes, as well as
monitoring required for continuing CRS improvements.
Actions
Action 2a: Assess and develop options to collect self-declared level of education data from
principal applicants and their spouses/partners; seek approval by the Director General Operations
Committee.
− Accountability: Lead SPPB. Support CDO, IB, TDSS
− Completion date: Q4 2020–2021
Action 2b: Develop a plan to implement the collection of self-declared education information,
contingent upon approval and available funding.

- 11 -
− Accountability: Lead SPPB. Support TDSS
− Completion date: Q1 2021–2022
At the launch of Express Entry, various tools were introduced to improve capacity to detect fraud and
manage risks. However, as the system evolved, the roles and responsibilities relating to the integrity of the
Express Entry system have become less clear and there was a lack of a systematic departmental
approach to address existing and emerging integrity issues. Given the potential for fraud as changes to
both the Express Entry system and the CRS are made and as economic immigration grows, there is a
need for a more purposeful and systematic approach to monitoring integrity and emerging risk areas.
Recommendation 3
IRCC should develop and implement a systematic approach to manage integrity in Express Entry.
Response
IRCC agrees with this recommendation.
Maintaining the integrity of the Express Entry system is crucial. While significant efforts are
underway to uphold integrity within individual cases and within each processing network, it is
acknowledged that a more systematic departmental approach to managing integrity risk would be
beneficial.
The Department approach to managing integrity risk in the Express Entry program will include
the following:
− Increasing clarity around roles and responsibilities related to integrity risk management in
Express Entry
− A mechanism to systematically manage emerging risks
− A purposeful approach to monitoring integrity risks
Once the roles and responsibilities related to Express Entry’s integrity risk management are
agreed upon, a new Permanent Risk Management Table would be established at the Director
level to carry out a number of activities:
− Ensure that key stakeholders from across the department are engaged at all levels to ensure
an accurate and complete representation of the risks in the EE systems;
− Provide strategic and functional guidance on integrity risks in Express Entry, such as
providing tools and coordinating specific measures to manage the risks;
− Ensure critical risk areas impacting programs managed under Express Entry are understood
and addressed, including fraud, criminality, health, error, etc;
− Prioritize and assess key program risks, with items requiring decision referred to the
appropriate DG-level committee.
IRCC will also plan and report on targeted quality assurance exercises related to Express Entry,
including recommendations for mitigation as required.

- 12 -
Actions
Action 3a: Document and obtain consensus on the roles and responsibilities related to integrity
risk management in Express Entry.
− Accountability: Lead IRM. Support IPG, CN, IN, DN, CMB
− Completion date: Q4 2020–2021
Action 3b: Establish a Permanent Resident Risk Table which will provide a forum to share and
discuss risk information, drive coordinated efforts to identify and manage risks across the
integrated network, and support functional direction on effective integrity risk management in
Express Entry.
− Accountability: Lead IRM. Support IPG, CN, IN, DN, CMB
− Completion date: Q4 2020–2021
Action 3c: Create a baseline of existing and planned program integrity measures related to
Express Entry in order to identify possible gaps and areas for improvement.
− Accountability: Lead IRM. Support IPG, CN, IN, DN, CMB
− Completion date: Q4 2020–2021
Implementation of Express Entry as an electronic application system resulted in efficiencies in application
processing, though the electronic nature of the system introduced some challenges associated with
accessibility of client and application information. For example, clients are not able to review their
supporting documents once they have uploaded them and before submitting to IRCC, rendering them
unable to rectify any errors that may have been made, such as uploading an incorrect document. In
addition, the system generates a new set of client information each time a client updates their EE profile.
Such challenges have in turn led to complications related to litigation and ATIP management - the
complex nature of the electronic application system has made it difficult to produce evidence when
litigation occurs and also makes it more difficult to produce a Certified Tribunal Record for the court. With
respect to ATIP, issues were identified with the system’s technical design for extracting profile information.
In addition, IRCC has experienced increased volumes of ATIP requests related to Express Entry
applications, which typically involves a large amount of documentation. These issues highlight an
opportunity to address certain inefficiencies in the electronic system for the benefit of clients and the
Department.
Recommendation 4
IRCC should develop and implement methods to:
1. Allow Express Entry clients to view their application and uploaded documents prior to,
and after applying; and
2. Improve accessibility of GCMS information to support the production of complete
records for operational, litigation and ATIP purposes.
Response
IRCC agrees with this recommendation.
The growing and changing digital demands on Canada’s immigration program are compounding
the pressures on the legacy IT systems which IRCC uses to deliver its services. IRCC has
developed a plan for stabilizing, modernizing and transforming its digital platforms to allow the
delivery of a world‑class client experience, while providing operational excellence, and meeting
program integrity objectives.

- 13 -
This plan includes a redesign of MyAccount as the cornerstone of IRCC’s digital client support.
The new MyAccount will enhance clients’ ability to self-serve by providing improved case status
information and additional functionality such as the ability for Express Entry clients to view
applications and uploaded documents prior to, and receive a copy after applying.
This work is part of a larger initiative underway to develop a new digital platform to help move
IRCC from paper-based to digital processing for all lines of business. It is expected that the new
platform will incorporate functionalities that allow for the efficient and effective production of
complete and readable records for operational, litigation and ATIP purposes for Express Entry.
This would allow records to be provided in a format that can be more easily stored, retrieved and
shared.
The recent COVID-19 pandemic and additional departmental priorities may require that IRCC
reconsider IT enabled priorities in order to meet immediate operational demands.
Actions
Action 4.1a: Submit business requirements to IT project intake for MyAccount 2.0 to TDSS
based on consultations with internal stakeholders. These business requirements will include
additional functionality to allow Express Entry clients to view their application and uploaded
documents prior to, and after applying.
− Accountability: Lead CEB. Support IPG, ATIP, CMB, TDSS
− Completion date: Q3 2020–2021
Action 4.1b: Determine prioritization, dependencies and implications to the Digital Platform
Modernization (DPM) initiative and a funding strategy to deliver MyAccount 2.0 requirements,
functions and features through IRCC’s IT governance process.
− Accountability: Lead TDSS/CEB. Support SPPB
− Completion date: Q4 2020–2021
Action 4.1c: Develop a plan to implement MyAccount 2.0.
− Accountability: Lead TDSS/CEB. Support SPPB
− Completion date: Q1 2021–2022
Action 4.2a: Conduct an analysis of Express Entry related issues in GCMS that affect the
efficient production of records, and from that analysis draft high-level business requirements to
be presented to the Director General level Operations Committee.
− Accountability: Lead IPG. Support CMB, ATIP, TDSS, CEB
− Completion date: Q4 2020–2021
Action 4.2b: Determine prioritization, dependencies and implications to the Digital Platform
Modernization (DPM) initiative and a funding strategy to deliver these requirements, functions
and features through IRCC’s IT governance process.
− Accountability: Lead TDSS/IPG. Support CMB, ATIP
− Completion date: Q4 2021–2022
Action 4.2c: Develop a plan to implement identified high-level business requirements.
− Accountability: Lead TDSS/IPG. Support CMB, ATIP
− Completion date: Q2 2021–2022

14
1. Introduction
1.1. Purpose of evaluation
This report presents the results of the evaluation of Immigration, Refugees and Citizenship
Canada’s (IRCC) Express Entry (EE) System and was conducted from January 2019 to
November 2019 in fulfillment of requirements under the 2016 Treasury Board Policy and
Directive on Results, considering primarily issues of system effectiveness. The primary area of
focus for the evaluation was the early economic performance of immigrants screened through EE,
and the evaluation also assessed the impact of the EE system on the economic immigration
categories. The evaluation also considered the impact of the EE system on two important
Government of Canada priorities, the official languages minority communities and gender, and
assessed flexibility, efficiency and integrity of EE.
1.2. Brief Express Entry profile
In the 2000s, there was a significant backlog of applications under the economic programs for
permanent residence. To respond to this issue, the Immigration and Refugee Protection Act
(IRPA) was amended through Bill C-50, the 2008 Budget Implementation Act. Bill C-50 made a
number of fundamental changes to the way in which immigration applications are managed: it
eliminated the obligation to process all applications received; and authorized the Minister to issue
Ministerial Instructions (MI) regarding which applications were prioritized for processing. These
MIs afforded the Minister the power to quickly limit the numbers of applications processed,
accelerate some applications, and return applications without processing them to a final
decision.
1
The Government of Canada long recognized the need for economic migration based on a slow
growing labour force, aging population and increasing demand for highly skilled labour. Coupled
with the high level of international competition for skilled migrants, there has been a known need
for Canada to improve its application system. As such, the Government of Canada decided to
change the way it manages the intake of economic permanent resident applications by launching
its EE system in January 2015.
EE is Canada’s evidence-based application management system for certain economic
immigration categories: Federal Skilled Worker Program (FSW), Federal Skilled Trades Program
(FST), Canadian Experience Class (CEC) and a portion of the Provincial Nominee Program
(PNP).
EE was designed with three main objectives in mind: 1) flexibility in selection and application
management, 2) responsiveness to labour market and regional needs and 3) speed in application
processing. In addition, the Comprehensive Ranking System is an evidence-based points system
designed to identify candidates most likely to achieve high employment earnings and therefore,
maximizing their economic performance in the Canadian labour market.
As a first step, prospective candidates complete an EE profile where they provide self-declared
information related to their education, work experience and other attributes. Those who meet the
minimum entry criteria for at least one of the three federally-managed economic immigration
1
Some sets of MIs restricted or capped applications from certain NOC. For example, under MI 8, an overall cap and sub-caps by
NOC for 24 eligible occupations, as well as a cap for Ph.D. applicants were introduced for the FSWP. Additionally, under MI 10,
six NOC B occupations could no longer be used to qualify for the CEC, and other NOC B occupations were sub-capped at 200
applications each. An overall cap was also applied to allow for 12,000 NOC 0 or A applications.

15
programs (FSW, FST, and CEC) are entered into a pool and, based on their profile, they are
awarded points using the publicly available Comprehensive Ranking System (CRS). These
candidates form a pool of prospective skilled immigrants to Canada, which IRCC,
Provinces/Territories and employers are able to consider.
2
ITAs are conducted in rounds that can be specific to one or more economic immigration
categories. For each round, IRCC determines the number of ITAs that will be sent to candidates.
During rounds, the number of ITAs are determined for the economic programs being targeted.
Based on the profiles in the pool and the number of ITAs issued, a minimum CRS cut-off is then
established for that round. Candidates with scores above the minimum CRS cut-off are
considered top-ranked candidates and will receive an invitation to apply. Applicants who receive
an ITA can then apply online for permanent residency through IRCC and will have their CRS
score, program eligibility and admissibility criteria assessed. If the applicant meets the eligibility
criteria and they and their dependents, meet the admissibility criteria, and still meets the
minimum CRS for that round, they are then approved for permanent residency.
1.2.1. The Comprehensive Ranking System
The Comprehensive Ranking System
3
(CRS) is the points-based system IRCC uses to determine
a candidate’s position in the EE pool. It ranks prospective skilled immigrants by looking at
specific factors such as work experience, language ability, education and other aspects which
have previously been shown to be associated with long-term economic success in Canada. As
such, the CRS was designed with the expectation that it would contribute to better economic
outcomes for economic immigrants.
4
The design of the CRS considered the short, medium and
long term impact of various components, while placing more weight on longer-term outcomes.
Factors in the CRS are generally grouped under two categories: Core points; and
Additional/bonus points.
Core points are made up of three components:
• Human capital factors refer to characteristics of the specific candidates themselves (e.g., age,
level of education, language proficiency).
• Spouse/common-law partner factors refer to characteristics of the candidate’s partner (e.g.,
spouse’s level of education, spouse’s Canadian work experience). The Comprehensive
Ranking System is comprised of two scales: one for single candidates, including married
candidates with a non-accompanying partner and one for candidates with an accompanying
partner. For candidates with an accompanying partner, human capital points are redistributed
to allow to consider their accompanying partner’s education, language proficiency and
Canadian work experience.
• Skill transferability points are assigned based on the understanding that the interaction
between certain factors increases a candidate’s potential for positive economic outcomes. For
example, given the positive effects of education on earnings are more readily transferred when
candidates have strong official language proficiency, candidates are awarded skill
2
Provinces and Territories can either ask economic immigrants to apply through the EE system, or can nominate economic
immigrants from the pool through an electronic portal. ESDC also provides a job matching service for EE candidates and
Canadian employers through Job Bank. Registering for Job Bank is voluntary for EE candidates.
3
For more information on the CRS, please see www.cic.gc.ca/english/immigrate/skilled/crs-tool.asp
4
Extensive econometric analysis were conducted to determine which factors, and to what extent, are best predictors of higher
employment earnings. Each factor was weighted to best reflect evidence on outcomes. The Comprehensive Ranking System
(CRS) was designed based on the results of this analysis.

16
transferability points if they are strong in both education and official language proficiency.
Additional points are awarded to candidates on the basis of policy or other objectives, and are not
necessarily related to human capital. At the time of conducting the evaluation, bonus points are
awarded based on provincial/territorial nomination, arranged offers of employment, post-
secondary education received in Canada, having a sibling who is a citizen or permanent resident
in Canada, and having high French language skills in addition to some English language skills.
5
Presently, candidates are able to earn a maximum of 1200 CRS points. Up to 600 Core points
may be awarded where 500 points are allocated between human capital factors and
spouse/common-law partner factors, where applicable, and 100 points are allocated for skill
transferability factors. A maximum of 600 additional points may also be awarded. A complete list
of the factors for which candidates receive points, and the respective values of each attribute are
available in Appendix A.
1.2.2. Economic programs covered under Express Entry
Four economic immigration programs are covered under EE: the Federal Skilled Worker
Program, the Canadian Experience Class, the Federal Skilled Trades Program, and the Provincial
Nominee Program.
The Federal Skilled Worker Program (FSWP) was developed as a part of Canada’s
immigration strategy, wherein permanent residents are selected on the basis of their ability to
become economically established in Canada. Applicants under the FSWP must have an
educational credential, meet minimum requirements of having at least one year of continuous
full-time paid employment, or the equivalent in continuous part-time employment within the last
10 years, in skill level 0, A or B in the National Occupation Classification (NOC), as well as
minimum language requirements of a Canadian Language Benchmark 7 or Niveaux de
compétence linguistique canadien 7. Applicants who meet the minimum requirements are then
given points for their work experience, education, language, age, arranged employment, and other
adaptability elements. Applicants who then meet a set pass mark (set at 67 points during the
period of the evaluation) will be eligible to receive an ITA.
The Canadian Experience Class (CEC) is a program that allows for skilled workers who have
Canadian work experience to become permanent residents. The CEC was introduced as a
pathway to increase Canada’s labour market responsiveness and global competitiveness in
attracting and retaining highly skilled workers and international graduates who had previously
demonstrated their ability to integrate into the Canadian labour market. CEC applicants are
required to have 12 months of Canadian work experience in NOC 0, A or B within the 36 months
prior to applying, and must also meet the language requirements associated with their respective
occupational level.
The Federal Skilled Trades Program (FSTP) allows skilled workers to become permanent
residents on the basis of their qualifications in a skilled trade. To be eligible for FSTP, a
candidate must meet minimum required language levels, have at least two years of full-time work
experience in a skilled trade within the five years prior to applying, meet the job requirements of
that skilled trade, and have either a valid job offer of full-time employment for a total period of at
5
Since the inception of the CRS, there have been several adjustments to these additional points. In November 2016 the points for
an arranged offer of employment were reduced from 600 points for all occupations, to 200 for NOC 00 occupations and 50 for all
other occupations. Points for Canadian study were also introduced. In addition, in June 2017, new points were added for siblings
in Canada and French-language proficiency. For more information see section 6.3.2.

17
least one year, or have a certificate of qualification in a skilled trade issued by a Canadian
provincial, territorial or federal authority.
The Provincial Nominee Program (PNP) is a jointly administered federal-provincial/territorial
immigration program that provides provinces and territories (PTs) with an opportunity to address
their specific labour market and economic development needs while distributing the benefits of
economic immigration across Canada. Under the authority of bilateral immigration agreements
with IRCC, eleven participating PTs establish their own streams, in consultation with IRCC, with
criteria that assess the candidate’s ability to become economically established in Canada and their
intention to reside in the nominating PT. If a candidate meets the PT PNP criteria, the PT issues a
nomination that allows the candidate to apply to IRCC for permanent residence. In addition,
under EE, PTs can create PNP streams with specific criteria that high skilled immigrants must
meet in addition to the eligibility criteria of one of the three federal economic immigration
programs.
PTs are able to nominate candidates through the EE pool (i.e., enhanced nominations), or through
PNP streams tailored to attract immigrants at all skills levels through paper-based applications
pre-dating EE (i.e., base nominations). PNP nomination allocations are determined by IRCC on
an annual basis. PTs have direct access to the EE pool through a portal that allows them to search
for, view and nominate candidates. In 2016, the enhanced allocation represented roughly 7,000
nominations over the approximate 25,500 base. Candidates who have a PT nomination in EE
receive an additional 600 points to their CRS score, which is usually sufficient to trigger an ITA
at the next round of invitations (subject to IRCC’s Ministerial Instructions for each particular
round of invitations).
At the onset of the EE, a processing hierarchy of economic programs was applied for those
candidates who were eligible to apply under multiple economic programs (e.g., meet the
minimum entry criteria for both FSW and CEC), with the exception of the PNP. The initial
hierarchy, in order of priority was FSTP, FSW, and CEC. During the timeframe covered by this
evaluation, changes were made with respect to the program hierarchy. Specifically, on June 26,
2015, the hierarchy was changed to prioritize the FSW, followed by the CEC, and finally the
FST. This change was made as prospective applicants did not want to apply under the more
complex FST if they had a choice. Further changes were applied to the hierarchy on March 9,
2016, with the priority becoming the CEC, followed by FSW and FST, in response to candidates’
strong preference to be invited to apply to the CEC, as well as to facilitate application processing.
1.2.3. Characteristics of Express Entry immigrants admitted to Canada between
2015 and 2018
A total of 200,868 EE immigrants – principal applicants (PA), spouses and dependants – were
admitted to Canada between 2015 and 2018. Of all EE admissions, over half (57%) were PAs.
The following characteristics were observed in EE PAs admitted between 2015 and 2018:
6
Immigration categories
Most of EE PAs were admitted either under the CEC (42%) or the FSWP (38%), while the
remainder were admitted under the PNP (17%) and the FSTP (2%).
When applying, EE PAs are assessed against the minimum entry criteria for each of the
programs. While 53% of the EE PAs were eligible for only one of the programs, 47% qualified
6
More details on the profile of economic immigrants can be found in Appendix B.

18
for more than one. As such, 73% of EE PAs admitted met the minimum entry criteria for the
FSWP, 56% met the criteria for the CEC, 18% for the FSTP, and 6% for the PNP.
Human capital attributes
Age
• 46% of EE PAs were between 20 and 29 years of age at admission; 51% of EE PAs were
between 30 to 44 years of age; and 3% were 45 years of age or more. Over time EE PAs
admitted tended to be younger with the share of EE PAs aged 35 years of age or more
decreasing (from 31% in 2015 to 20% in 2018) in favor of those aged 20 to 29 years old (34%
in 2015 to 46% in 2018).
Education
• 84% of EE PAs had a university degree. Overtime, the share of EE PAs with a university
education increased considerably: in 2015, only 38% reported having a university degree,
while 92% of EE PAs admitted in 2018 did so.
• Following the introduction of points in the CRS for Canadian study in November 2016, about
30% of the PAs admitted in 2017 and 2018 obtained points for having obtained a Canadian
post-secondary credential.
Knowledge of official languages
• The majority of EE PAs reported knowing English only (96%), while 0.5% reported knowing
French only, and 4% reported some knowledge of both official languages. The share of EE
PAs reporting some knowledge of both official languages increased slightly over time from
2% in 2015 to 4% in 2018.
• Based on CRS information, PAs usually had a high level of proficiency in their first official
language, with over 50% of them having obtained a level 10 on the Canadian Language
Benchmark (the highest level at which the CRS grants points for language proficiency), in
three of the four language skills assessed (listening, reading and speaking).
Temporary status
• Two thirds of EE PAs had previous temporary resident status in Canada (66%). 64% of EE
PAs had received a work permit and 39% had received a study permit. While the vast majority
(96%) of EE PAs admitted in 2015 had previous TR status in Canada, this share decreased
after the first year and represents about half (52%) of EE PA admissions in 2018.
• While 43% of all EE PAs had no or less than a year of work experience in Canada, 36% had
one year of experience, 16% had two years, and 6% had three years or more.
− In addition, 20% had received points in their application for having a job offer in Canada.
CRS Points
• EE PAs scored 413 points on average out of a maximum of 600 on the core CRS element
(human capital, spouse and skill transferability), and 606 on average out of a total of 1,200
possible points when including additional points for arranged employment, provincial
nomination, education in Canada, French-speakers and siblings in Canada.
• While the average core CRS points of PAs increased over time, reflecting the increasing
human capital of candidates, the total CRS score decreased because of the large influx of

19
applications with job offer points at the introduction of EE, and of the reduction in those job
offer points in November 2016.
Other Socio-demographics
Gender
• Close to two thirds of EE PAs were male (63%). While men represented 69% of the EE PA
admission in 2015, their share declined over time to represent 60% in 2018.
Country of Citizenship
• The most common countries of citizenship among PAs admitted were India (40%), China
(9%), Nigeria (5%), Philippines (4%) and the United Kingdom (4%). Together, these countries
represented 62% of all EE PAs admitted.
• The share of EE PAs originating from India more than doubled over time from 21% in 2015 to
45% in 2018.
Spouse
• About 42% of the PAs admitted had an accompanying spouse.
Occupations
NOC skill level of the intended occupation
• 47% of EE PAs intended to work in occupations usually requiring university education (NOC
A), 40% in occupations usually requiring college education or apprenticeship training (NOC B)
and 13% in management occupations (NOC 0). While individuals intending to work in
occupations usually requiring college education or apprenticeship training (NOC B) comprised
68% of admission in 2015, this share decreased over time in favor of individuals intending to
work in occupations usually requiring university education (from 25% in 2015 to 52% in 2018).
• Over one third of EE PAs (35%) intended to work in occupations related to natural and
applied sciences, 24% in business, finance and administration occupations, and 16% in sales
and service occupations. If individuals intending to work in sales and service occupations
accounted for a considerable portion of admissions in 2015 (44%), this share decreased over
time to represent only 12% of EE PAs in 2018.
Top Occupations
• The top five intended occupations for EE PAs were: professional occupations in natural and
applied sciences (25%), professional occupations in business and finance (9%), administrative
and financial supervisors and administrative occupations (8%), service supervisors and
specialized service occupations (8%), and technical occupations related to natural and applied
sciences (8%).
Location in Canada
Intended province of destination
• 91% of EE PAs indicated either Ontario (57%), Alberta (14%) or British Columbia (20%) as
the province of intended destination. Over half (52%) of PAs admitted in 2015 intended to
settle in Alberta, however, this proportion declined over the years (7% in 2018), while the
proportion intending to settle in Ontario increased (from 25% in 2015 to 65% in 2018).
As indicated above, the composition of EE PAs has changed over time in many respects,
including age, education, previous TR status in Canada, and intended occupation. These changes
were, to a large extent, the result of modifications to the CRS grid over time, mainly regarding

20
the significant reduction in points for arranged employment. While 72% of EE PAs admitted in
2015 had received points for a job offer, this share declined over time to represent 32% of EE PA
admission in 2016, 21% in 2017 and 10% in 2018.

21
2. Methodology
2.1. Questions and scope
The evaluation scope and approach were determined during the evaluation planning phase, in
consultation with IRCC branches involved in the design, management and delivery of EE. The
evaluation assessed the issues of performance of the EE system for the period of 2015 to 2018,
and was guided by the evaluation matrix, which outlines the evaluation questions and
performance indicators for EE (see Appendix C).The evaluation was conducted internally by
IRCC Evaluation Division.
7
The evaluation questions are as follows:
1. To what extent are economic immigrants screened under the EE system becoming
established economically?
2. Are the economic immigrants screened using the EE system performing better than those
admitted outside of the EE system?
3. To what extent has the EE system enabled the economic programs to be responsive to
labour market and regional needs?
4. How has the EE system impacted the profile of admissions under the economic programs
(FSW, CEC, FSTP, PNP)?
5. To what extent are the EE system and Economic Programs contributing to Official
Language Minority Communities (OLMC) initiative objectives?
6. What is the impact of the EE system on the gender distribution and outcomes within the
Economic program?
7. What have been the early impacts of EE on efficiency, flexibility and integrity on the
economic immigration programs?
2.2. Data collection methods
Data collection and analysis for this evaluation took place from January 2019 to September 2019
and included multiple lines of evidence that gathered qualitative and quantitative data from a
wide range of perspectives, including IRCC, PTs, other key stakeholders such as employers and
clients. The different lines of evidence supporting the evaluation are described below:
Data Analysis
Available performance data on EE and non-EE economic immigrants from IRCC’s Global Case
Management System (GCMS), including CRS information, as well as the Longitudinal
Immigration Database (IMDB)
8
were analyzed.
Although EE was introduced in 2015, about half of economic PAs admitted between 2015 and
2018 were not screened in using EE, as they had applied prior to January 2015 or were
considered under the base PNP applications. The evaluation used these non-EE PAs as a
comparison group against which to compare EE PAs. The EE group included individuals who
were admitted under the Federal Skilled Worker Program, the Canadian Experience Class, the
Federal Skilled Trades Program, as well as the Provincial Nominee Program. While the EE group
only included PAs intending to work in NOC 0, A or B occupations, there was no NOC
restriction applied to the non-EE group. As a result, a portion of the non-EE group includes PAs
7
Drafting of evaluation findings and recommendations preceded the current COVID-19 situation.
8
At time of analysis, the IMDB contained information up to tax year 2016. This was augmented with wages and salaries
information which provided data up to 2017.

22
intending to work in non NOC 0, A, or B occupations, unless specified otherwise.
9
Throughout
the report, “EE PAs” refers to PAs who were screened in under EE, while “non-EE PAs” refers to
PAs who were admitted to Canada under the same time frame (2015-2018) but were not screened
in through the EE system.
The IMDB was used to look at economic results. At the time of analysis, the IMDB contained
information up to tax year 2016. This was augmented with wages and salaries information which
provided data up to 2017. The evaluation was able link CRS data with data in the IMDB
(including wages and salaries information) for the first time.
In addition, IRCC relied on data from ESDC’s Job Bank for the first time for an evaluation,
which included information on employers’ province of operations, job offers and types of
occupations targeted. Information from these various sources was used to provide profiles and
performance information on the system.
Economic Immigrant Survey
An online survey was administered in February 2019 to economic PAs who received their
permanent residence between 2015 and 2018. A total of 44,409 PAs completed the survey, for an
overall response rate of 19%. This represents a margin of error of ± 0.42%, using a confidence
interval of 95%.
The majority of the analysis excluded PAs admitted in 2018, as most of this cohort would not
have been in Canada for a full year at the time of the survey. Unless specified otherwise the
analysis concentrated on PAs admitted between 2015 and 2017 (n=27,419)
Similar to the approach taken for the analysis of administrative data, the evaluation was also able
to benefit from having a direct comparison group against which to compare outcomes of EE PAs.
All survey results presented in this report are statistically significant.
Employer Survey
An exploratory online survey was administered to employers with active profiles on the Job Bank
website (www.jobbank.gc.ca) and were looking to fill job vacancies in NOC 0, A or B
occupations in 2018. Invitations to fill out the survey were sent out to 25,233 employers. A total
of 4,231 employers completed the survey, for an overall response rate of 17%.
Document Review
Relevant EE documents were reviewed to gather background and context on EE, as well as to
assess its performance. Documents reviewed include: government documents (e.g., budgets,
Reports on Plans and Priorities), documents related to policy changes and the management of the
system, and literature about the Canadian labour market.
Interviews
A total of 38 interviews were conducted across multiple branches within IRCC, as well as three
provincial representatives. Interviews included both those currently working directly or in
support of EE, as well as some involved at the launch of EE.
9
About 20% of the non-EE PAs were intending to work reported intending to work in occupations that were not in NOC 0, A or B
(i.e., in NOC C, D or other). These individuals were mainly admitted under the PNP base category of the non-EE PAs, and few
came under the FSWP.

23
Case Studies
10
The evaluation conducted four case studies on specific occupations of interest: pharmacists,
Information and Communications Technology (ICT) occupations, chefs and cooks, and food
services. The case studies involved a review of administrative data and documents, and an
analysis of the results from the Economic Immigrant survey for these specific occupations.
2.3. Limitations and considerations
There were a few limitations, although overall, they did not have a significant impact on the
evaluation findings:
• Given its recent implementation, this evaluation assessed the impact of the EE system in terms
of early client economic outcomes. However, the EE system was designed to maximize long-
term labour market outcomes. As such, while early results suggest a positive impact on
economic immigrant outcomes, longer-term analysis is still required to assess whether the
system is performing as intended.
• Since its introduction, changes were made to the CRS which may have changed the profile of
PAs in Canada and their economic outcomes. The evaluation only examined the economic
outcomes of EE candidates who applied in 2015 and 2016 with the IMDB due to a two year
lag in data availability. As a result, the economic analysis produced in this evaluation may not
reflect the current EE system. While it takes some time for candidates to be screened against
the revised CRS criteria and to be admitted as PRs, this was mitigated with the survey of
economic immigrants that included more recent admission cohorts.
• Level of education is not a mandatory field in the electronic application and, as a result, not all
candidates invited to apply for permanent residence submit information on their educational
credentials. As such, some candidates may choose not to go through an educational credential
assessment (ECA) process and have their education assessed for CRS points. As a result of
this, the level of education is unknown for some candidates, which limits the ability to fully
examine the impact of education on economic outcomes. Similarly, spousal human capital
fields are not mandatory, unless a candidate wishes to claim CRS points for their
accompanying spouse. Consequently, some spousal attributes will not be captured, which
limits the ability to fully examine the impact of spousal attributes on PA earnings as well as
the spouse’s own earnings.
• Although results from the survey of employers may serve as an indication of employers’
experiences with Job Bank, this survey was exploratory in nature. As such, survey results are
not meant to be representative of all Canadian employers who have used Job Bank.
Overall, the evaluation design employed numerous qualitative and quantitative methodologies.
The different lines of evidence were complementary and reduced information gaps, and the
results generally converged towards common findings. The triangulation of the multiple lines of
evidence, along with the mitigation strategies used in this evaluation are considered sufficient to
ensure that the findings are reliable and can be used with confidence.
10
As this was not considered a key line of evidence for this evaluation, results from the Case Studies are presented in Appendix G.

24
3. Early economic results
The following section presents early economic results of EE PAs on labour market participation,
employment income and type of employment.
While IMDB data presents information on all tax filers admitted within the first two years of the
inception of EE, for up to one year after admission, the survey of economic immigrants presents
results for PAs admitted between 2015 and 2017.
Throughout the section, outcomes of EE PAs are compared to their non-EE counterparts admitted
over the same time period to identify the impact of EE on early economic outcomes of
immigrants.
As will be discussed throughout Section 3, the vast majority of EE PAs have become established
economically. Moreover, economic results of EE candidates exceed those of non-EE candidates
admitted over the same time period, both in terms of incidence of employment and quality of
employment.
11
The evaluation also explored the early economic outcomes of spouses of PAs admitted under EE
and compared their outcomes to those that were not screened-in using EE.
3.1. Labour market participation
Finding: Nearly all Express Entry principal applicants had a job in their first years as a permanent
resident. Moreover, incidence of employment for Express Entry principal applicants exceeded that of non-
Express Entry principal applicants and the biggest difference between the two groups was found for
Federal Skilled Workers.
IMDB data indicates that the majority of EE and non-EE candidates were working the year they
were admitted to Canada as PRs (92% of EE PAs and 81% of non-EE PAs). This proportion
increased further in the first year following their admission (95% of EE PAs and 87% of non-EE
PAs).
The incidence of employment is higher for EE PAs compared to non-EE PAs. In the year of
admission, there was an 11 percentage point difference between EE and non-EE PAs. Although
smaller (i.e., 9 percentage points), the gap in incidence rate between EE and non-EE PAs
remained one year after admission.
11
For this comparison, the non-EE group includes PNP nominees who intended to work in NOC C and D occupations. PAs
screened in through EE are admitted on the basis that they intend to work in NOC O, A or B occupations.
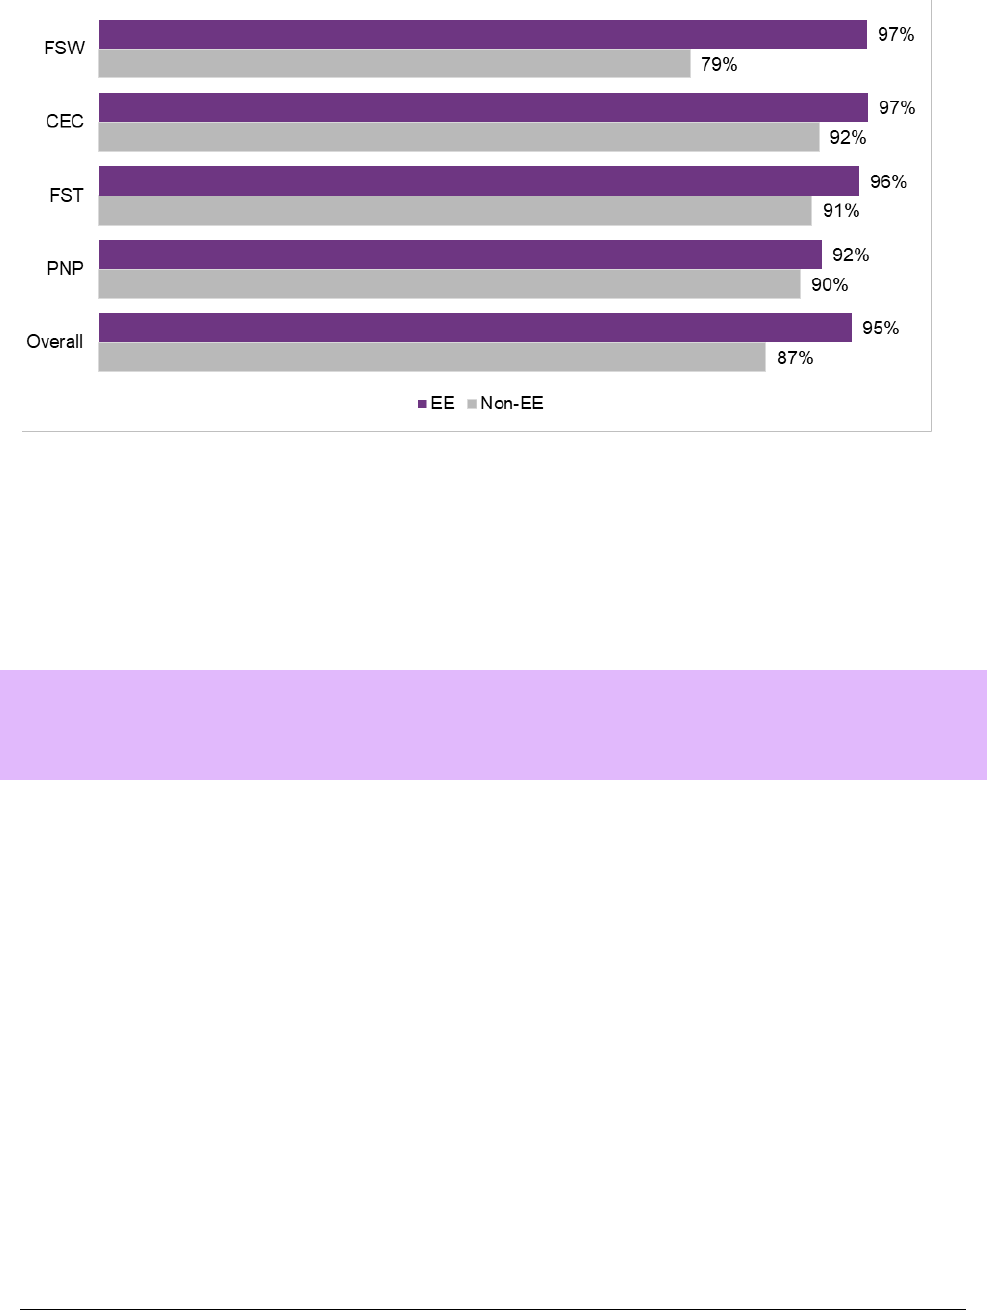
25
Figure 1: Incidence of employment income one year after admission by immigration categories,
2015 and 2016 admissions
Source: IMDB 2016 – 2015-2016 admissions
When comparing by immigration categories and immigration regimes, for all immigration
categories, EE PAs always had a higher incidence of employment compared to non-EE PAs one
year after admission. Also CEC and FSW EE PAs had the highest incidence, followed closely by
the FST. The largest difference between EE and non-EE one year after admission was observed
for FSWs (97% vs. 79%, respectively).
3.2. Job history
Finding: Generally, Express Entry candidates are employed in higher skilled occupations than their non-
Express Entry counterparts and a greater proportion reported working in their primary occupation and in
jobs commensurate with their skills and experience.
3.2.1. First job after obtaining permanent residence
Closely aligned with incidence results from the IMDB, the results from the survey of economic
PAs show that nearly all EE (91%) and non-EE (89%) survey respondents reported that they
worked, either for pay or in self-employment, since they became a permanent resident in Canada.
Skill type
Table 1 presents the three most common industries (NOC skill type) in which EE and non-EE
respondents were working in their first job. About one third (34%) of EE respondents were
working in Natural and applied sciences and related occupations for their first job, and 22%
worked in Business, finance and administration occupation. While these two sectors were also the
most frequently reported by non-EE respondents for their first job in Canada as a PR (23% and
18% respectively), the proportion working in these sectors was lower than for EE respondents.
Sales and services occupations were the third type of occupations reported, with 18% of EE and
28% of non-EE respondents working in this type of occupation as their first job.

26
Table 1: Occupation types in which Express Entry and non-Express Entry respondents are
employed at time of first job after obtaining permanent residence
Skill type (first NOC digit) Description of skill type EE Non-EE
1 Business, finance and administration occupations 22% 18%
2 Natural and applied sciences and related occupations 34% 23%
3
Sales and services occupations
18% 28%
Source: Economic Immigrant Survey, 2019
Skill level
As to the skill level required for their first job as a PR, EE respondents were concentrated in
occupations requiring university education (NOC skill level A–43%). Another significant share
were working in occupations usually requiring college education or apprenticeship (NOC skill level
B–28%), and in management occupations (NOC skill level 0–11%). Together NOC skill level 0, A
and B accounted for 82% of occupations of EE respondents. They were however less to report
working in occupations usually requiring secondary school and/or occupation-specific training or
on-the-job training (NOC skill level C–11% and D–2%). Comparatively, non-EE respondents were
more distributed across all skill levels (skill level 0–11%, A–27%, B–28%, C–22% and D–8%), and
fewer were working in a first job requiring a NOC skill level of 0, A or B (66%).
Occupations
The ten most common occupations, as reported by EE and non-EE respondents, are presented in
Table 2. The most frequent occupations among EE respondents were Software engineers and
designers (8%) and Information systems analysts and consultants (5%). While these occupations
were also among the most frequent for the non-EE respondents, a smaller proportion reported
working in those occupations as their first job in Canada. Only one occupation for EE
respondents was below the NOC 0, A or B skill level (i.e., Retail salesperson at the NOC C skill
level, which accounted for 2% of the first job of EE respondents), while three of the top 10
occupations for non-EE were at the NOC C or D level (i.e., Retail salespersons and Transport
truck drivers at the NOC C skill level, and Food counter attendants, kitchen helpers and related
occupations at the NOC D skill level, together accounting for 8% of the first occupations of non-
EE respondents).

27
Table 2: Top 10 occupations in which Express Entry and non-Express Entry respondents were
employed at time of first job after obtaining permanent residence
NOC
(EE) Occupation (EE) %
NOC
(Non-EE) Occupation (Non-EE) %
0
Computer and information systems
managers
2% 0
Restaurant and food service
managers
2%
A
Software engineers and designers
8% 0
Banking, credit and other
investment managers
2%
A
Information systems analysts and
consultants
5% A
Software engineers and designers
4%
A
Post-secondary teaching and
research assistants
2% A
Information systems analysts and
consultants
3%
A
Financial auditors and accountants
2% A
Post-secondary teaching and
research assistants
2%
A University professors and lecturers 2% B Food service supervisors 2%
A
Computer programmers and
interactive media developers
2% B
Cooks
2%
B Cooks 2% C Retail salespersons 3%
B Food service supervisors 2% C Transport truck drivers 2%
C
Retail salespersons
2% D
Food counter attendants, kitchen
helpers and related occupations
3%
0 Other occupations 10% 0 Other occupations 7%
A&B Other occupations 47% A&B Other occupations 43%
C&D Other occupations 11% C&D Other occupations 22%
Source: Economic Immigrant Survey, 2019
3.2.2. Job at time of survey
Over one-third of survey respondents reported that they were no longer working in the same first
job and were working in a different job at the time of the survey (in February 2019). The majority
of EE (86%) and non-EE (82%) respondents reported working at the time of the survey. Of the
EE respondents who reported that they were working at the time of the survey, the majority
(83%) indicated that they were doing so in their primary occupation.
12
The top occupations, skill type and skill level for the job PAs held at the time of the survey were
similar to that of the first job for both EE and non-EE respondents. In addition, almost half of EE
(48%) and one-third of non-EE respondents (35%) were working in their intended occupation at
the time of the survey. Moreover, the majority of EE (81%) and non-EE (74%) respondents
reported that their current job meets or exceeds the expectations they had prior to becoming a PR.
Lastly, a greater proportion of EE respondents felt that their current job matched their education,
skills and experience compared to non-EE (77% vs. 67%). More specifically, 55% of EE
respondents and 45% of non-EE respondents felt that their current job matched their education,
skills and experience to a great extent.
12
The primary occupation refers to the job PAs have experience in (within the last 10 years) and on which they based their
immigration application.

28
3.2.3. Professional advancement
Finding: Express Entry and non-Express Entry principal applicants reported career advancement from an
occupational perspective and in terms of employment income. While non-Express Entry principal
applicants were more likely to report career advancement, their first jobs were more likely to be lower
skilled.
As mentioned above, over one-third of survey respondents reported that they were no longer
working in the same first job and indicated that they were working in a different job at the time of
the survey. When comparing EE and non-EE groups, a larger proportion of non-EE (41%) than
EE respondents (36%) reported that they changed jobs.
Professional advancement
For the most part, the change in jobs resulted in positive results for both EE and non-EE
respondents. In terms of occupational changes, survey results show that:
• a larger proportion of EE respondents (60%) reported that they had changed jobs within the
same NOC skill level compared to non-EE respondents (49%); and
• a larger proportion of non-EE (34%) than EE respondents (24%) indicated that they had
changed jobs to a higher NOC skill level.
While a larger proportion of non-EE respondents reported upward movement from an
occupational perspective, it should be noted that nearly one-third of non-EE respondents (30%)
who changed jobs were working in lower skilled (NOC C and D) occupations in their first job,
compared to 13% of EE respondents. As a result, non-EE respondents in lower skilled
occupations would have more opportunities for upward mobility.
Additionally, from an earnings perspective, the large majority of EE (83%) and non-EE (85%)
respondents reported an increase in their employment income when comparing self-reported
earnings for their first job to that of their job at the time of the survey.
Motivations for changing jobs and challenges
In terms of the motives for changing jobs, EE and non-EE respondents provided similar reasons
for moving to a new position. The most common reasons cited by respondents include:
• better pay and benefits (69% of both EE and non-EE);
• better advancement, promotion or development opportunities (63% of EE and 57% of non-EE);
• better working hours (36% of EE and 38% of non-EE); and
• to find a job in their area of specialization (36% of EE and 38% of non-EE).
While data from the IMDB and survey show positive employment results, EE and non-EE
respondents cited various challenges they encountered while finding work in Canada since
becoming a permanent resident. Survey results show that:
• a larger proportion of non-EE respondents (38%) cited “a lack of Canadian work experience”
as a challenge in finding work in Canada, compared to 31% for EE respondents;
• nearly one-quarter of non-EE respondents (22%) indicated that they encountered challenges in
having their credentials assessed and recognized, compared to 14% for EE respondents; and
29
• approximately one-quarter of EE and non-EE respondents also indicated that they encountered
challenges in accessing professional networks and that there were limited job opportunities in
their field.
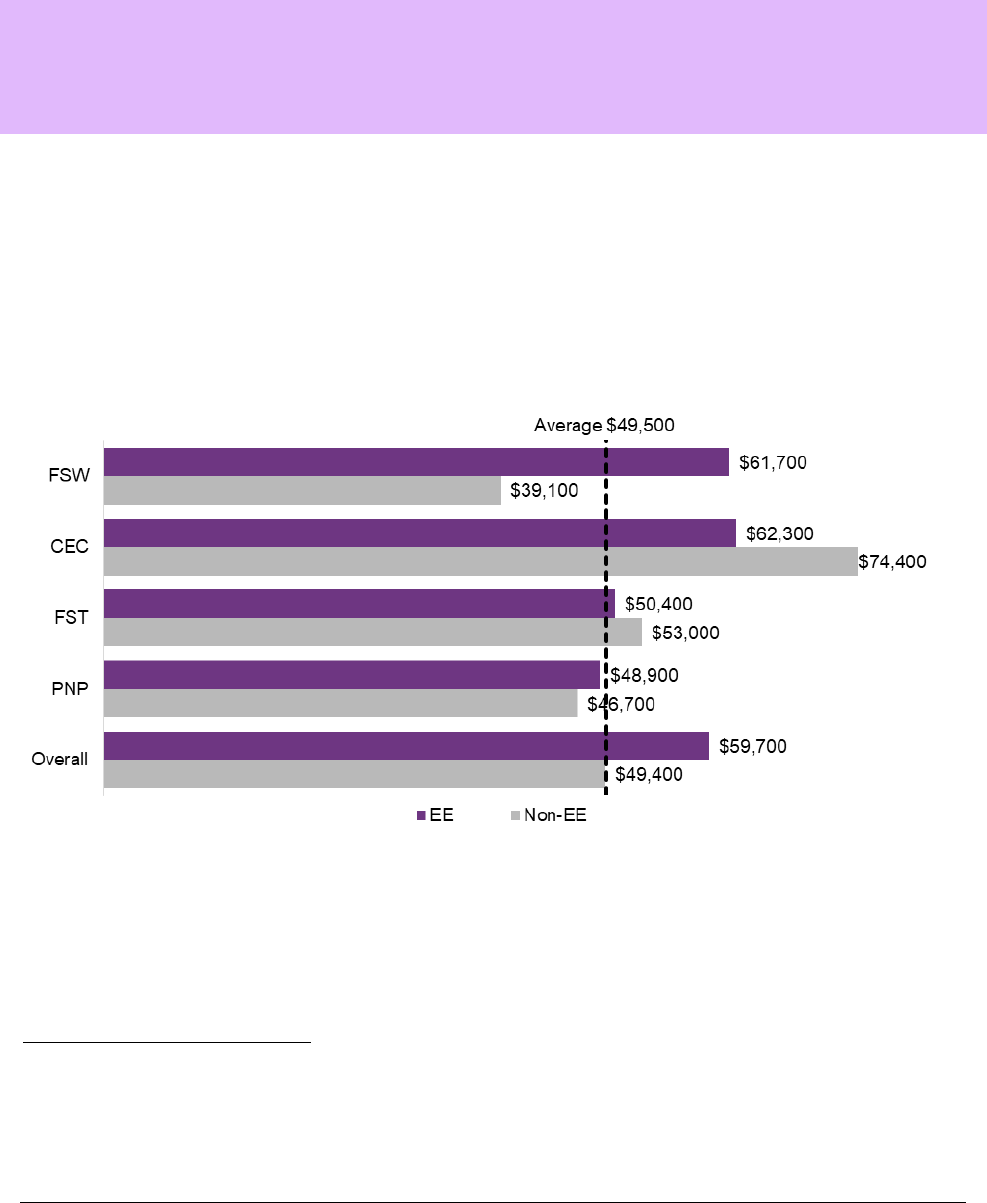
3.3. Average employment income
Finding: Overall, Express Entry principal applicants have higher employment income on average than
their non-Express Entry counterparts. When compared to non-Express Entry, Express Entry principal
applicants in Federal Skilled Worker and Provincial Nominee Programs had higher earnings, while those
in Canadian Experience Class and Federal Skilled Trades had lower earnings.
3.3.1. Employment income
Analysis of IMDB data shows that, overall, EE PAs had higher incomes than their non-EE
counterparts, both in their year of admission and first full year since admission. One year after
admission, EE PAs earned on average $59,700, which is $10,300 more than the average income
of non-EE PAs or 20% higher. In addition, EE PAs had average earnings that were $10,200
above the Canadian-born (i.e., Canadian citizens by birth) average.
13
Figure 2: Average employment income one year after admission by immigration categories, 2015
and 2016 admissions
Source: (1) IMDB 2016 – 2015-2016 admissions and (2) Statistics Canada, 2016 Census of Population, Statistics Canada Catalogue
no. 98-400-X2016205
While EE FSWs and PNs both reported average incomes higher than their non-EE counterparts
one year after admission, EE PAs admitted under the CEC and FST both reported lower
employment income than non-EE one year after admission, with the biggest differences were
observed within the FSW and CEC categories.
14
Although EE-CEC and EE-FST earned less than
their non-EE counterparts, when multivariate regressions were conducted (see section 3.3.2), no
13
While this may serve as an indication of how EE PAs are performing economically, this is an imperfect comparison group, as the
Canadian-born include individuals include individuals trained and working in all types of occupation, including lower skilled levels
such as NOC C and D occupations, whereas the EE group is more skilled and were screened based on their intention to work in
high skilled occupations. In addition, the non-EE group benefits from established social networks in Canada, of a better
knowledge of the Canadian context and a larger part of them are not new entrants on the Canadian labour market.
14
As discussed in section 1.2, MIs were issued pertaining to caps and exclusions for specific occupations prior to the introduction
of EE, which affects the occupational profile of the two groups.

30
statistical differences in earnings between the two groups remained. This means that differences
in earnings between the EE and non-EE groups come from the differences in the profile of these
two groups, such as differences in intended occupation (skill level and skill type), age, gender,
education, etc.
3.3.2. Effectiveness of the Comprehensive Ranking System
To have a better understanding of the impact of the EE system and CRS attributes on early
economic outcomes, regression analyses on employment earnings were conducted,
15
based on
IMDB wage and salary information and the survey of economic immigrants.
Finding: The Express Entry system is an effective filtering mechanism, screening in individuals who have
stronger short-term economic performance in Canada compared to those not screened in through the
system.
3.3.2.1. Effectiveness of Express Entry as a filtering mechanism
A regression was done without controlling for characteristics of PAs in both the EE and non-EE
group,
16
to see whether there was a difference in short-term earnings. Recognizing that the CRS
was designed to maximize longer term outcomes, short-term results indicated that EE PAs
admitted between 2015 and 2016 earned about 20% more in 2017 than their non-EE counterparts
admitted over the same time period (see Appendix D, table 16 for full regression results).
After controlling for various human capital and other socio-demographic attributes, the earnings
advantage of the EE group over the non-EE group reduced, with a remaining difference in
earnings of about 8% between the two groups. Most of this reduction can be attributed to
previous TR earnings, followed distantly by country of citizenship (see Appendix D, table 17
17
).
Among other factors accounting for this reduction, there is the difference in intended occupations
(skill level and skill type), the share having English or French as mother tongue and level of
education. Put differently, these results indicate that the system is screening for individuals who
have a different profile, which contributes to increased economic performance.
Additional regression analyses were conducted to see whether differences in earnings between
the EE and non-EE groups were consistent across the four immigration categories. Results
showed that the increased earnings of the FSW and PN PAs over their non-EE counterparts
remained after controlling for other characteristics. Furthermore, results showed the lower
earnings of CEC and FST EE PAs relative their non-EE counterparts could be explained by the
characteristics included in the analysis (e.g., education, intended occupation, previous TR
experience, age, gender) (See Appendix D, table 18).
Finding: When only considering those screened in via Express Entry, some elements outside the
Comprehensive Ranking System were found to be key in predicting short-term earnings, while the
Comprehensive Ranking System had a limited impact, potentially because the system has already filtered
for individuals with high human capital.
15
For the purpose of the regression analysis, non-EE PAs intending to work in NOC C and D were excluded.
16
The reason this was not controlled is that a central objective of the EE system was to screen immigrants with different
observable characteristics than those who would be selected under the previous policy regime. If the evaluation was to
regression-control for these observed characteristics, it would be eliminating this potential source of difference in immigrant
outcomes.
17
Following the methodology described by Hou (2014), effect decomposition was performed to better understand what explains the
gap in earnings between EE and non-EE, using regression coefficients and means for EE and non-EE groups.

31
3.3.2.2. Impact of the Comprehensive Ranking System on short term economic outcomes
Regressions were also conducted using 2017 wage and salary information for EE PAs admitted in
2015 and 2016 to understand better the effectiveness of the CRS attributes in determining early
economic outcomes. As some elements of the CRS were modified or added at the end of 2016
and in June 2017, additional analyses were conducted to see the impact of these changes using
the survey of Economic PAs that was conducted in February 2019.
Wages and salaries in 2017
Comprehensive Ranking System grid
When looking only at the CRS, regressions on 2017 employment income indicated that all
elements of the core human capital attributes of the CRS have an impact on employment income
of EE PAs, with the exception of the knowledge of a second official language (see Appendix D,
table 19, model 1). Other elements such as skills transferability points and arranged offers of
employment points also had a positive impact on earnings. While the presence of an
accompanying spouse was also positively associated with employment income, some spousal
attributes decreased this impact.
18
Earnings predictors – beyond the Comprehensive Ranking System grid
Additional analyses were conducted to better understand earnings predictors beyond those
elements included in the CRS. Elements such as previous earnings as a TR were introduced to the
analysis as they can potentially predict after-migration earnings. In the case of previous earnings
as a TR, research suggests that pre-immigration earnings are a good indicator of “realized market
value” of an immigrant’s human capital (Hou and Picot, 2014; Hou and Bonikowska, 2018). In
addition, TR earnings are at least partly the reflection of some aspects of human capital, which
include education and work experience, but also other human capital traits (e.g., knowledge of
specific skills, language ability, ability to learn), which aligns with the underlying premise of the
CRS. Other elements such as the NOC skill level and skill type of the intended occupation,
gender, country of citizenship, year of admission and province of intended destination were also
introduced into the analysis.
Regression results indicate that many attributes of the CRS have an impact on short term earnings
of EE PAs. Once controlling for other socio-demographic characteristics, these effects lessen or
even disappear (see Appendix D, table 19, model 2). These factors include age, education,
Canadian work experience, skill transferability factors, and to a lesser extent, knowledge of
official languages and arranged offers of employment. More specifically, holding all other things
constant, the following results were obtained:
• The CRS attribute that had the greatest impact on earnings was knowledge of a first official
language. Compared to PAs with a CLB of 10 or more, those with a CLB of 4 to 5 had
earnings that were 22% lower and those with CLB 9 earned 5% less.
• Years of Canadian work experience had a limited impact on earnings once information related
to previous earnings in Canada, and intended occupation were introduced. When significant,
Canadian work experience was negatively associated with earnings, as most of the benefits
related to previous TR status were already accounted for by controlling for earnings as a TR.
18
As this is not a mandatory field, some PAs may not have received points for the human capital characteristics of their
accompanying spouse, despite having one, if they did not submit supporting evidence. As such, results related to accompanying
spouse attributes on earnings should be interpreted with caution.

32
• Having an arranged offer of employment led to 10% higher earnings.
• Age had an impact on earnings for those aged 45 years or older, who had 7% higher income
compared to those aged between 20 and 29.
• Presence of an accompanying spouse was positively associated with employment income.
However, some accompanying spousal attributes (i.e., certain level of education and Canadian
work experience for the spouse) were negatively associated with employment income, while
others did not have any significant impact (i.e., certain level of education and official language
proficiency of the spouse).
• The only element of skills transferability that had a significant positive impact on earnings was
the combination of foreign and Canadian work experience, which led to higher earnings.
Most of the differences in earnings are explained by other socio-demographic characteristics
outside the CRS, including wages earned as a TR in Canada, NOC skill type and skill level of the
intended occupation, gender, country of citizenship, and year of admission. The characteristic
with the biggest impact on earnings was the amount PAs were earning as TRs. With the
exception of those who earned $24,999 or less, earnings as a PR increased in line with the
amount of money earned as a TR.
19
Those who earned between $25,000 and $49,999 had 20%
higher earnings than those who did not work in Canada as a TR, while those who earned
$100,000 or more as a TR had earnings that were 116% higher.
Further analyses to understand which characteristics best predict the earnings of EE indicated that
the amount of wages earned as a TR was the most important predictor of earnings as a PR PAs
(see Appendix D, table 20). However, the predictive power of the CRS was modest.
20
The limited
impact of the CRS in explaining differences in earnings among EE PAs may in part be due to the
fact that it screened for individuals with high human capital, introducing some homogeneity
within the EE group. These results should not be interpreted negatively as the system was found
to be successful at screening individuals with characteristics conducive in the short-term for
economic success in the Canadian labour market.
Changes to the Comprehensive Ranking System and early economic outcomes - earnings in
2019
At the time of analysis, the data available in the IMDB, and its wages and salary module, did not
include the most recent admission cohort. Therefore the analysis could not explore the impact of
the changes introduced to the CRS at the end of 2016 and in 2017. As a result, the survey of
economic immigrants supplemented IMDB data and allowed for exploring early impacts of
reducing points for arranged employment, as well as introducing points for education in Canada,
French-speaking and having siblings in Canada.
21
19
Modeling this as a categorical variable allowed to compare outcomes of individuals who did not work in Canada as a TR to those
who did and assess the impact of various earning levels without assuming a linear relationship.
20
i.e., explaining 0.9% in the variance in employment income among EE PAs in 2017.
21
For the purpose of the regression analysis, all survey respondents (including the 2018 cohort) were considered for the analysis,
to include as many PAs that were subject to the revised CRS grid.
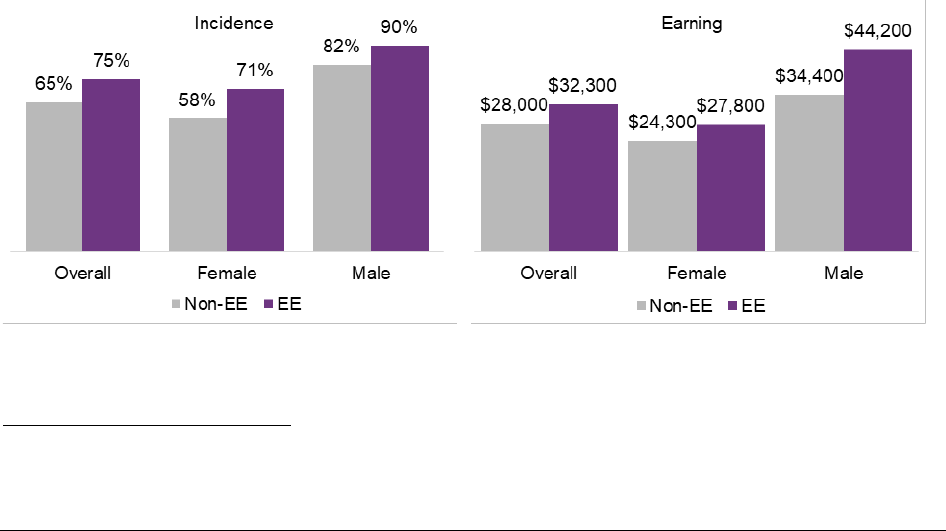
33
Results of this analysis are aligned with what was found with the wage and salary information
presented above (see Appendix D, table 21).
22
Similar effects were found for age, knowledge of
the first official language, Canadian work experience and skills transferability factors.
Similarly, having an arranged employment offer also had a positive impact on earnings. Those
processed after the reduction in arranged employment points who had a job offer in a NOC 00
occupation had the greatest advantage, with earnings 60% higher than those with no offer of
employment. Those who were processed after the changes to arranged employment points and
who had received an offer in a non-NOC 00 occupation had a smaller earnings advantage (21%)
compared to those with no arranged employment offer. Those who were processed under the
initial arranged employment offer points had earnings 30% higher than those who did not have an
arranged employment offer, suggesting a mix in the NOC profile of those who received points for
an arranged employment offer.
While education in Canada had a positive effect on earnings and siblings in Canada had a
negative effect on earnings, when only CRS attributes were included in the regression model, this
effect disappeared after the introduction of other socio-demographic attributes. French-speaker
points had a significant negative impact, lowering earnings by 13%. Finally, having a provincial
or territorial nomination had a positive impact on earnings, increasing them by 3%. In summary,
analysis of the employment situation at time of the survey provides early indication that changes
that were made to the CRS had an impact on earnings.
3.4. Labour market outcomes of Express Entry spouses
IMDB data indicates that most of the spouses of EE PAs admitted under the system were
working in Canada one year after they were admitted, and that this share was higher than for
spouses that were not screened-in using EE (75% of the EE spouses compared to 65% for the
non-EE spouses). In addition, EE spouses earned on average $32,300, which is $4,300 more than
for their non-EE counterparts.
Figure 3: Incidence of employment income (a) and average employment income (b) for Express
Entry and non-Express Entry spouses
Source: IMDB 2016 – 2015-2016 admissions
22
The proportion of variance in earnings explained by the model including CRS information only was relatively modest (13%).
Similarly, the IMDB analysis explained 17% of the variance in employment income in the model containing only CRS information.
This indicates that beyond the CRS, other attributes could explain the economic performance of PAs. The proportion of the
explained variance increased to 24% for survey data when other socio-demographic characteristics were added.

34
4. Responsiveness of Express Entry to labour market
needs
The following section presents findings on the responsiveness of the EE to Canadian labour
market needs. Key performance indicators include: average time to secure employment, pre-
arranged offer of employment and employers’ perception on how EE supports their needs.
Finding: Express Entry is responsive to labour market needs in that Express Entry candidates find work
quickly and respond to specific employer needs through job offers.
4.1. Finding jobs quickly and pre-arranged offer of employment
As indicated in section 3.2.1, 90% of survey respondents obtained a first job in Canada since
becoming a permanent resident. EE respondents found jobs twice as fast as non-EE respondents:
it took an average of 1.4 months for EE respondents to secure this job, while it took an average of
3.0 months for non-EE respondents. Moreover, three-quarters (76%) of EE respondents already
had this job within the first month of obtaining their permanent residence, compared to 66% for
non-EE respondents. Moreover, 66% of EE survey respondents indicated that they had started
working in this first job prior to becoming a PR, compared to 54% for non-EE respondents.
In addition, approximately 22% of EE respondents had received points for a pre-arranged offer of
employment. Of the respondents who had a pre-arranged job offer and reported that they had
worked since obtaining permanent residence, 86% indicated that they worked for the same
employer who provided them with an offer of employment to support their application for
permanent residence.
4.2. Employers’ needs and experience with the Express Entry system
4.2.1. Employers’ needs
The evaluation conducted a survey of employers with Job Bank accounts who were looking to fill
positions at the NOC 0, A or B skill levels, seeking their perspectives on their labour needs and
experience using immigration as a potential tool to respond to these needs.
23
Survey results indicate that employer respondents have encountered a number of labour
challenges; the most common ones include: skills shortages (i.e., inability to find workers with
the required skills, education or credentials) (71%); labour shortages (i.e., inability to find
candidates for different positions) (65%); and workforce turnover (42%). Further, when asked to
rate the availability of qualified workers in their region, over half of respondents (53%) provided
a rating of “poor” or “none”.
More than half of respondents indicated that their organization has tried to recruit/hire foreign
nationals (53%) to address challenges, of which nearly two-thirds (65%) reported
recruiting/hiring PRs.
23
See Appendix E for more details on the Employer Survey Profile.

35
4.2.2. Employers’ experience with Express Entry system
Of the respondents who reported that they had hired a foreign worker to respond to their
organization’s labour needs (n=1,105), nearly three-quarters (72%) indicated having some
knowledge of the EE system. More specifically, 44% reported having made a job offer to one or
more EE candidates; 28% were aware of EE but had not made a job offer to any EE candidates;
and 28% were not aware of EE.
Of the employers who made a job offer to one or more EE candidates:
• Three quarters (74%) indicated having hired at least one EE candidate;
• 43% felt that EE was “very useful” in responding to labour needs/shortages;
• 33% were “very satisfied” with the process of recruiting/hiring EE candidates;
• Over half (57%) would be “very likely” to recruit/hire EE candidates in the future.
The majority of employers reporting having some knowledge of the EE system highlighted that
EE provides access to highly skilled and qualified workers to meet labour needs and address
shortages (78%). When asked about the benefits of the EE system, almost two-thirds indicated
that EE allows employers to have a role in recruiting foreign nationals to meet their labour needs
(63%).
However, while respondents provided generally positive perspectives on the EE system, nearly
half (46%) of employers who had used the EE system reported that their organization
encountered challenges in recruiting/hiring the EE candidates. Of the respondents who
encountered challenges with the EE process, the main challenges identified included:
• Labour Market Impact Assessment (LMIA) process was burdensome (65%)
• Time to process the candidate(s) application for PR was too long (56%); and
• EE process was not clear (e.g., eligibility requirements, Comprehensive Ranking System
(CRS) points, job offer requirements, etc.) (48%).

36
5. Impact of Express Entry on profile of admissions under
the economic programs
Finding: Despite the changing profile of principal applicants admitted under Express Entry, differences
remain when comparing the characteristics of principal applicants across programs.
5.1. Profiles of economic immigrants admitted – 2015 to 2018
EE PAs have a profile that somewhat differs from the one of economic PAs admitted prior to the
introduction of EE or non-EE PAs admitted during the first four years following the introduction
of EE. Although non-EE PAs demonstrated a high human capital profile, EE PAs show even
stronger human capital attributes (see Table 3).
As such, EE PAs are younger, with less than 3% that are aged over 45 at time of admission,
compared to about 12% for economic PAs admitted in 2014. In addition, all reported knowing at
least one of Canada’s official languages, and a higher share have university education (84%
compared to 71% for non-EE). Consequently, more EE PAs also intended to work in occupations
requiring university education (34% pre-EE compared to 47% for EE PAs), and none intended to
work in low-skilled occupations, given EE targets only NOC 0, A and B, whereas intermediate
and elemental occupations (NOC skill level C and D) represented over 10% of intended
occupations of non-EE PAs. There are also more EE PAs who have studied in Canada prior to
obtaining permanent residence (about 30% for non-EE, compared to 39% for EE PAs).
Table 3: Socio-demographic profile of economic principal applicants* by immigration regime
Socio-demographic
characteristic
Economic PAs (2014)
(n=48,830)
Non-EE PAs – 2015 to
2018 (n=117,260)
EE PAs – 2015 to 2018
(n=114,539)
Age
Under 45 years old 88.4% 90.2% 97.5%
45 years old or more 11.6% 9.8% 2.5%
Education level
No university degree 28.7% 29.0% 15.9%
University degree 71.3% 71.0% 84.1%
Knowledge of official languages
English 92.9% 94.8% 95.7%
French 0.1% 0.2% 0.5%
English and French 3.6% 3.0% 3.8%
Neither 3.3% 1.9% 0.0%
TR Status
No previous TR status 34.9% 37.8% 34.4%
Previous TR status 65.1% 62.2% 65.6%
Work Permit Status
No previous work permit 36.1% 38.8% 35.7%
Previous work permit 63.9% 61.2% 64.3%
Study Permit Status
No previous study permit 70.5% 69.2% 60.9%
Previous study permit 29.5% 30.8% 39.1%

37
Socio-demographic
characteristic
Economic PAs (2014)
(n=48,830)
Non-EE PAs – 2015 to
2018 (n=117,260)
EE PAs – 2015 to 2018
(n=114,539)
NOC skill level
0–Managerial 13.1% 14.6% 13.3%
A–Professionals 33.7% 28.9% 47.0%
B–Skilled and technical 37.8% 36.2% 39.6%
C–Intermediate and clerical 6.2% 9.6% 0.0%
D–Elemental and laborers 4.0% 5.8% 0.0%
Other NOC skill level 5.1% 4.9% 0.1%
*Table includes PAs admitted under all economic programs including FSTP, FSWP, CEC and PNP, excluding Quebec cases
Source: GCMS
In addition to having more human capital, there are also indications that EE PAs are a more
homogenous group in various aspects (see Appendix B for more details). EE PAs are more
concentrated in terms of country of citizenship, with 40% coming from India (whereas India,
which was also the top country, accounted for 26% of the 2014 economic PA admissions), as
well as in younger age groups. As per the requirements under EE, EE PAs are also more
concentrated in higher skill level occupations.
5.2. Impact on economic programs’ admission profiles
As discussed in section 5.1, the profile of PA admitted has changed in some aspects since the
introduction of EE. The following section examines whether the introduction of EE has also had
an impact on the profile of the different economic programs under EE.
The profile of economic PAs admitted in 2014 under each of the four immigration categories, the
FSWP, CEC, FSTP and PNP, was compared to the profile of EE PAs admitted between 2015 and
2018 (see Appendix B for more details). Overall the main differences in terms of human capital
attributes, intended occupations and geographic distribution that were observed between
immigration categories prior to EE were still noticeable after the introduction of EE. More
specifically, the following was found:
• Age: EE PAs were younger than PAs before the introduction of EE, and similar to the profile
of PAs admitted in 2014, the CEC were the youngest, followed by the PNP, FSWP and those
admitted under the FSTP the oldest.
• Education: With the introduction of EE, the share of PAs with university education increased
across immigration programs, while this increase was most obvious for the FSWP and the
enhanced PNP. Similar to the situation in 2014, a greater share of FSW PAs had university
education compared to those under other economic programs. However, the share with
university education amongst the PN PAs is greater than under the CEC.
• Previous TR: While the share of EE PAs with previous TR status in Canada remained
relatively unchanged when compared to the year prior to the introduction of EE, the share with
TR status increased with EE for the FSWP, and decreased for the PNP and the FSTP.
Nevertheless, the trends that could be noted in terms of prior TR status by program remained.
The FSWP was the program under which the smallest share of PA had prior TR status in
Canada (27% in 2014 vs. 31% for EE PAs), while the CEC (99% for both pre-EE and EE
PAs) and the FST (89% pre-EE and 85% for EE PAs) had the highest.

38
• NOC: Consistent with the trends observed prior to the introduction of EE, the FSWP was the
program that had the greatest share of its PAs intending to work in NOC A, while the CEC
was the program with most PAs intending to work in NOC B occupations. NOC profile of
PNs got however more concentrated in NOC A and B, as the PNs admitted under EE have to
intend to work in a NOC 0, A or B position to qualify under EE.
• Geographic distribution: Similar to the distribution prior to the introduction of EE, PAs
admitted under the FSWP, the CEC and the FSTP primarily intend to settle in Ontario, Alberta
and British Columbia. Pre-EE, PAs under the PNP were distributed across Canada. While PN
PAs admitted under EE appear to be more concentrated in certain provinces, due in part to the
fact that not all PTs are using EE evenly in recruiting high skilled immigrants, admissions
under the PNP remain more diverse in terms of intended destination compared to the other
three federal economic immigration programs.
Thus, although EE makes it possible to identify immigration candidates with a higher potential
for positive economic outcomes, candidates admitted under different economic immigration
programs have contrasting profiles.
24
For example, candidates admitted to the FSWP are highly
educated, mainly intending to work as professionals, while the CEC candidates are younger. The
FSTP allows for the admission of candidates intending to work in specific professions, but who
are generally less educated and slightly older than those admitted under the other programs.
Finally, the PNP is an amalgam of several characteristics, namely a strong education, Canadian
experience but especially a greater geographical dispersion across Canada.
Prior to EE, prospective PAs to Canada submitted their applications under the economic program
of their choice. However, under EE, applicants who receive ITAs are invited to apply under a
specific economic program based on the invitation round. For instances where a round includes
multiple economic programs, there is an established program hierarchy. The current program
hierarchy prioritizes applications under CEC. However, there are also rounds of invitations for
specific economic programs (e.g., FSTP) in order to ensure admissions in all of the programs
managed by EE.
24
However, as there is an economic program hierarchy for applicants, some of these differences may be attributed to the program
hierarchy and not candidate characteristics. For more on program hierarchy see Section 1.2.2.

39
6. Other Express Entry outcomes
6.1. Contribution to official language minority communities
Finding: Express Entry has contributed to promoting and facilitating economic immigration of French-
speaking individuals outside Quebec and to increasing the number of French-speaking economic principal
applicants.
Activities to support official language objectives
In support of objectives in Canada’s 2013-2018 Official Languages Strategy, foundational
documents suggest the EE system may be used by employers and other stakeholders to draw
French-speaking skilled immigrants to work and settle in Francophone Minority Communities.
Since the introduction of EE, a variety of activities have targeted increasing French speaking
admissions. Improvements were made to EE in November 2016 to remove the requirement to
acquire an LMIA to receive arranged employment points. This change benefitted temporary
workers who wished to become permanent residents, including those qualified under Mobilité
Francophone.
Moreover, additional points for French-language Proficiency were introduced in 2017, which
gave candidates 15 or 30 bonus points based on their knowledge of French or knowledge of both
official languages; by achieving these points, a candidate is able to increase their overall ranking
in the pool. Additionally, throughout the scope of the evaluation, a variety of stakeholder
engagement activities were held which focused on increasing French-speaking admissions,
including webinars, conferences, and working groups.
French-speaking admissions
In assessing the number of French-speaking EE PAs admitted to Canada between 2015 and 2018,
the data showed that 2.3% of EE PAs either had French as their mother tongue or reported
knowing French only, in terms of knowledge of Canada’s official languages at time of admission.
Comparatively, prior to the introduction of EE, 1.2% of 2014 economic PAs were French-
speaking and 1% of non-EE PAs admitted over the same time period were French-speaking.
Consequently, the proportion of French-speaking economic PAs has almost doubled. This is
however, a conservative measure of French-speakers, as it potentially excludes French-speakers
who are bilingual, and is less aligned with the CRS that values bilingualism amongst French-
speakers.
The knowledge of French can also be assessed through another field captured in IRCC’s
administrative data, the self-declared knowledge of Canada’s official languages. Using this
variable, the proportion of French-speakers is slightly higher. Between 2015 and 2018, 4.3% of
the EE PAs admitted reported knowing French, either French only (0.5%) or both French and
English (3.8%). Moreover, this share increased over time, from representing 2.5% in 2015, to
4.7% in 2018. This increase may in part be attributed to the introduction of additional points for
French-language proficiency introduced in 2017. However, information from the self-declared
knowledge of official languages may overestimate the number of French-speakers, as some who
are primarily Anglophone (i.e., not Francophone) may self-declare knowledge of both French and
English.
25
25
In 2020, IRCC introduced a new measure to count French-speaking immigrants. With this measure, French-speaking immigrants
are: a) Permanent residents who declare knowledge of “French only” as their official language; or b) Permanent residents who

40
In terms of intended destination, a greater proportion of French-speakers than non-French-
speakers intended to settle in:
• Ontario (61% for French-speakers vs. 57% non-French-speakers);
• British Columbia (25% for French-speakers vs. 20% non-French-speakers); and
• New Brunswick (4% for French-speakers vs. 1% non-French-speakers).
On the other hand, a smaller proportion of French-speakers
26
than non-French-speakers intended
to settle in the other provinces (10% and 22.5% respectively).
As per the EE year-end reports, the proportion of profiles submitted by candidates who were
awarded bonus points for French-speaking, and the proportion of invitations to candidates
awarded bonus points for French-speaking is increasing. The proportion of invitations awarded to
French-speaking candidates was 5% in 2018 compared to 2% in 2015, and the proportion of
candidates in the pool was 4% in 2018 compared to 1% in 2015.
6.2. Impact of Express Entry on gender
6.2.1. Gender-based socio-demographic profile
Finding: The introduction of Express Entry has slightly increased the proportion of female admissions to
economic programs as principal applicants. Furthermore, Express Entry female principal applicants have
more Comprehensive Ranking System-based human capital than males (both Express Entry and non-
Express Entry) and non-Express Entry female principal applicants.
Over a third of EE PAs were women (37%). The share of women is slightly higher under EE,
than prior to the introduction of EE (34%) or to the non-EE PAs admitted between 2015 and 2018
(35%). This is consistent within immigration categories, with the exception of PNP for which the
overall share remained unchanged. The share of is the highest for FSWP (42%), followed by
CEC and PNP (35% each) and the lowest for FSTP (10%). The share of women under EE also
increased over time, from 31% in 2015 for EE to 40% in 2018.
Comparing the profile of EE male and female PAs, EE female PAs demonstrated slightly higher
levels of human capital than males between 2015 and 2018. Females are somewhat younger (49%
of women are between 20 to 29 years of age vs. 45% for men), are more to have university
education (89% vs. 82%), and to report knowledge of both of Canada’s official languages (5%
vs. 3%). These differences in the profile of EE male and females are reflected in the CRS scores
obtained. Aligned with the stronger human capital attributes of women, they obtained on average
higher scores on the core CRS components than men (425/600 points vs. 407/600 points on
average), while men score higher on the overall CRS (589/1200 for women vs. 617/1200 for men
on average) reflecting the higher share of males with job offer points.
The profile of women is also more diverse in terms of country of origin (33% of women are from
India vs. 45% for men) and intended occupation. Although professional occupations in natural
and applied sciences (NOC 21) was the top occupation for both males and females, half as many
women intended to work in this occupation (16% vs. 31%). An equal share of both male and
declare knowledge of “French and English” as their official languages, as well as French as the language in which they are most
at ease. At the time of conducting this evaluation, this new measure had not been implemented.
26
Using the definition of French-speakers as having French as mother tongue or reporting knowing French only, in terms of
knowledge of Canada’s official languages at time of admission.
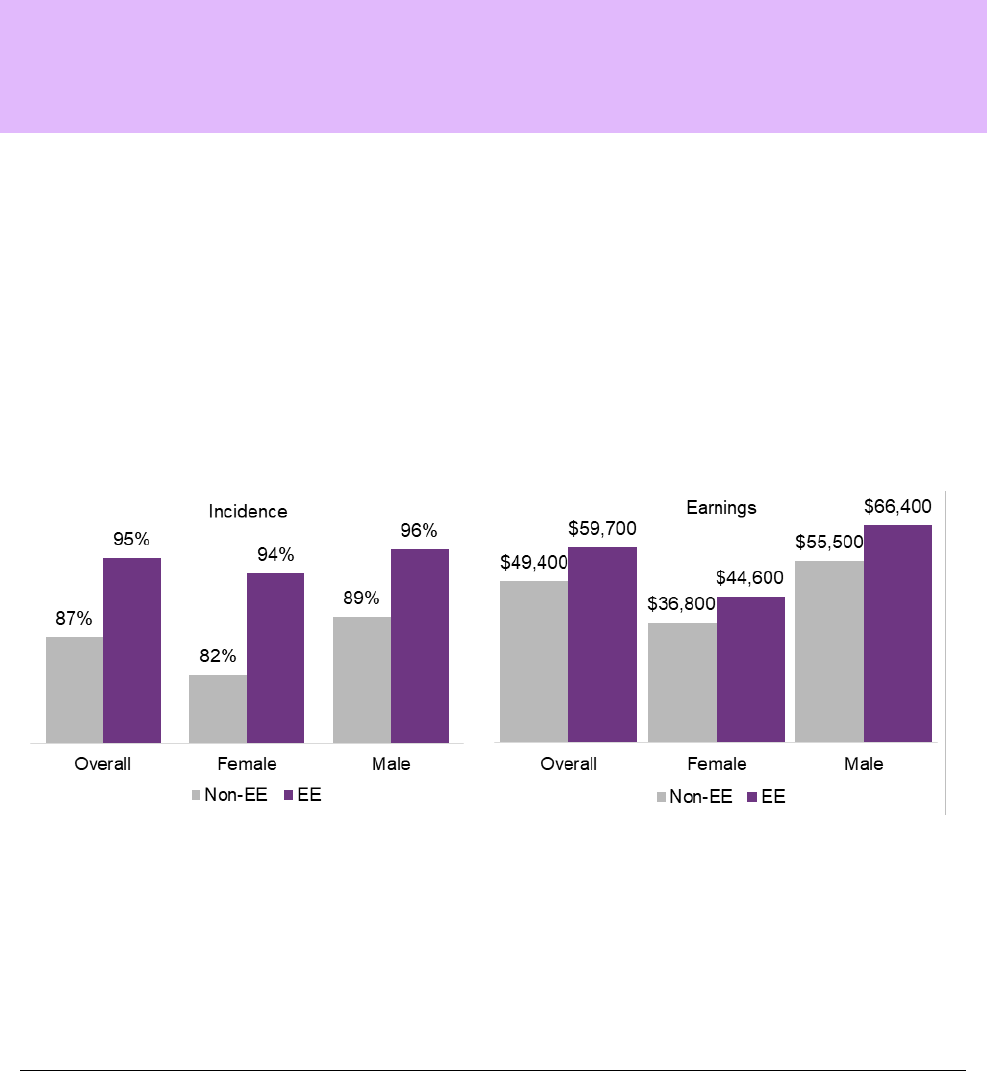
41
female intended to work in professional occupations (NOC A), women were slightly more
represented in skilled and technical occupations (NOC B) (41% vs. 39%) and less represented in
managerial occupations (NOC 0) (12% vs. 14%). In addition, women are more represented in
business, finance and administration occupations (34% vs. 18%), while men are more
preponderant in natural and applied sciences and related occupations (22% vs. 42%). While fewer
women have had previous work permits in Canada as a TR, they are more represented amongst
those who have had previous study permits. These differences between men and women PAs are
also consistent with pre-EE, and 2015-2018 non-EE PA gender profiles.
6.2.2. Gender-based economic outcomes
Finding: Despite having higher human capital than males, early economic outcomes are less favorable for
Express Entry female principal applicants: females had lower employment income and a lower proportion
of females reported working in their primary occupation and in jobs commensurate with their skills
compared to male.
IMDB findings indicate that EE male and female PAs had a higher incidence of employment and
earnings compared to their non-EE counterparts. Further, results show that:
• the difference in the incidence of employment between EE and non-EE PAs is larger for
females (11%) than for males (7%);
• the difference in average employment income between EE and non-EE PAs is smaller for
females ($7,800) than for males ($10,900);
• EE female PAs had a higher incidence of employment than non-EE female and male PAs; and
• EE and non-EE female PAs had lower earnings compared to EE and non-EE male PAs.
Figure 4: Incidence of employment income (a) and average employment income (b) for express
entry and non-express entry male and female principal applicants
Source: IMDB 2016 – 2015-2016 admissions
Regression analysis on employment income in 2017 indicated that EE has a similar impact for
men and women (See Appendix F, Table 22 and 23). Both men and women have higher earnings
than their non-EE counterparts, even after controlling for their individual profiles. In addition,
when restricting the analysis to PAs admitted though EE, the different attributes of the CRS tend
to have a similar impact on both genders. Among the notable differences between genders is the
impact of having Canadian work experience, which has a bigger positive impact for women than

42
men, and the human capital characteristics of the accompanying spouse, which has a negative
impact on earnings for women PA, but a positive impact for men PA.
Gender differences were also observed in the results from the survey of economic PAs,
particularly when comparing labour market participation outcomes and quality of employment
for EE male and female respondents. Results show that while EE female respondents generally
reported more positive outcomes than their non-EE male and female counterparts, EE men
reported more positive results overall. Results are presented in Table 4, with key differences
being as follows:
• The proportion of EE females (84%) reporting working at the time of the survey was slightly
lower than for EE males (87%) but somewhat higher compared to non-EE females (78%).
• Half of EE male respondents (50%) were working in their intended occupation at the time of
the survey, compared to 39% of EE female respondents.
• A larger proportion of EE males (85%) and EE females (79%) reported working in their
primary occupation at the time of the survey.
• A slightly smaller proportion of EE female (72%) than EE male respondents (79%) felt that
their current job matched their education, skills and experience.
• 83% of EE male and 79% of EE female respondents reported that their current job meets or
exceeds the expectations they had prior to becoming a PR.
Table 4: Occupation and quality of employment survey results for express entry and non-
express entry male and female respondents
Employment outcomes
EE
Male
EE
Female
Non-EE
Male
Non-EE
Female
Working at time of survey 87% 84% 84% 78%
Working in NOC 0, A or B level occupations at time of
survey
84% 82% 72% 67%
Working in intended occupation (at 2-digit NOC level) 52% 41% 38% 31%
Working in primary occupation 85% 79% n/a n/a
Current job matches education, skills and experience to a
“great extent”
58% 50% 47% 41%
Current job meets or exceeds expectations they had prior to
becoming a permanent resident
83% 79% 75% 73%
Source: Economic Immigrant Survey, 2019
In terms of challenges in finding employment in Canada since obtaining their permanent
residence, both EE gender groups provided similar responses. The most common challenges cited
include: lack of Canadian work experience (32% of female and 31% of male respondents);
limited access to professional networks (23% of female and 21% of male respondents); and few
job opportunities in their field (21% of male and 19% of female respondents).

43
6.3. Impact of Express Entry on efficiency, flexibility and integrity
The following section presents findings on the efficiency, flexibility and integrity of the EE
system. Key performance indicators for this section include perceptions of processing officers on
issues like application processing, litigation, ATIP and service standards. For the purposes of the
evaluation, flexibility, efficiency and integrity of EE were assessed by the Strategic Policy and
Planning Branch and incorporated with the rest of the evidence presented above.
6.3.1. Efficiency
Finding: While Express Entry has resulted in greater efficiencies in application processing, it has
introduced inefficiencies in litigation and Access to Information and Privacy fulfillment.
6.3.1.1. Timeliness of the application process
As noted in section 1.2, a key objective of EE is speed in application processing. The service
standard for Federal Skilled Trade, Federal Skilled Worker, Canadian Experience Class and
Provincial Nominee applications received via EE is to process complete applications
(applications with complete information and supporting documents), within six months for 80%
of cases.
27
Comparatively, the current service standard for paper-based PNP applications is 11 months, not
including any time it takes for the province/territory for their processing. Prior to the March 2015
launch of the existing EE processing standards, economic programs had individualized service
standards, or no service standard at all. For example, CEC had a processing standard of 80% of
cases processed within 10 months. Prior to EE, length of time to process cases was considerable,
as shown in Table 5.
Table 5: Historical processing time (in months) for 80% of cases
Application type
Pre-EE
2009
Pre-EE
2010
Pre-EE
2011
Pre-EE
2012
Pre-EE
2013 EE- 2018
Federal Skilled Workers (Pre C-50) 60 64 71 79 88 6
Federal Skilled Workers (Post C-50) 16 17 22 30 42 6
Provincial/Territorial Nominees 11 13 15 16 17 6
Canadian Experience Class 6 11 15 13 13 5
Source: Book of Basics, Calendar Year 2014 and EE year-end report, 2018
Processing time under EE has decreased considerably compared to prior to the introduction of the
EE system and the service standard under EE has largely been meet with two exceptions. FST
application processing in 2018 reached 7.5 months and enhanced PNP applications reached 6.4
months in 2017 but reduced back below the 6 month standard as of 2018, as shown in Table 6.
The achievement of processing standards has been credited to the alignment of application intake
via invitation rounds, with admissions, as well as to an increase in processing capacity.
27
The six month period begins when IRCC confirms that a candidate has submitted a complete electronic application for
permanent resident through their MyCIC account. The processing period ends when a final decision is made.

44
Table 6: Processing times of Express Entry applications (2015-2018) in months
Immigration category 2015 2016 2017 2018
Canadian Experience Class 3.5 6.0 4.2 4.9
Federal Skilled Workers 4.7 6.0 3.7 6.0
Federal Skilled Trades 4.9 5.9 5.7 7.5
Provincial Nominee Program 3.8 5.2 6.4 5.7
Source: CIC Enterprise Data Warehouse as of January 22, 2019 [CEC, FSW and FST]
Source: CIC Enterprise Data Warehouse as of February 12, 2019 [PNP]
6.3.1.2. Year-End Inventories
In 2014, prior to the introduction of EE processing time service standards, processing time for
FSW applications fell considerably due to the elimination of the pre-C-50 application backlog
and application caps. Application caps were also used in this time to limit new intake of CEC and
FST applications. Inventories are shown in Tables 7 and 8.
Table 7: Permanent resident processing inventory (2009–2014)
Immigration category 2009 2010 2011 2012 2013 2014
Federal Skilled Workers 552,974 520,957 478,195 109,171 62,354 59,884
Pre C-50 FSW 416,079 339,741 306,535 11,102 2,977 524
Post C-50 FSW 136,895 181,216 171,660 98,069 59,377 59,360
Federal Skilled Trades n/a n/a n/a n/a 147 548
Canadian Experience Class 4,504 4,874 9,198 10,030 23,846 20,560
Provincial/Territorial Nominees 35,440 44,614 55,346 47,498 55,140 47,210
Source: (CIC Enterprise Data Warehouse) as of January 22, 2019
Table 8: Permanent resident processing inventory (2015–2018)
Immigration category 2015 2016 2017 2018
Federal Skilled Workers (EE) 8,964 3,056 13,450 38,643
Federal Skilled Workers (Pre C-50
28
) 97 62 39 44
Federal Skilled Workers (C-50) 16,659 3,874 1,803 529
Federal Skilled Traded (EE) n/a n/a n/a 1,799
Federal Skilled Trades (C-50) n/a n/a n/a 1
Canadian Experience Class (EE) n/a n/a n/a 17,972
Canadian Experience Class (C-50) n/a n/a n/a 103
Source: (CIC Enterprise Data Warehouse) as of January 22, 2019
6.3.1.3. Refusal rates
As presented in Table 9, the refusal rates
29
for EE cases ranged from 2.5% for FSW to 17.6% for
CEC between 2015 and 2018 and refusal rates for non-EE cases ranged from 4.3% for CEC to
64.0% for FSTP between 2014 and 2018.
28
See program profile section for more information on C-50.
29
Refusal rates refer to the proportion of finalized applications processed by IRCC that were refused in a given year.

45
Table 9: Refusal rates (2014–2018)
Immigration category 2014 2015 2016 2017 2018
Federal Skilled Workers (EE) n/a 8.1% 5.0% 2.5% 2.7%
Federal Skilled Workers (C-50) 19.9% 9.7% 16.0% 23.2% 25.6%
Federal Skilled Traded (EE) n/a 9.1% 9.4% 8.7% 11.8%
Federal Skilled Trades (Non-EE) 64.0% 25.0% 25.0% 20.0% n/a
Canadian Experience Class (EE) n/a 17.6% 7.8% 4.4% 6.6%
Canadian Experience Class (Non-EE) 4.3% 5.2% 5.9% 16.7% 19.2%
Source: CIC Enterprise Data Warehouse as of January 22, 2019
6.3.1.4. Benefits and challenges
When asked about the benefits of EE, the majority of processing officers felt that the main benefit
was faster processing time. One commonly provided efficiency was that e-applications, as
opposed to the previous paper-based system, save time on mailing, filing, storing and retrieving
files. Furthermore e-applications enable easier sharing of files across networks, regardless of
physical location. Officers also commonly cited improved communication with clients via the
online client portal (MyCIC) as an efficiency gain, as the MyCIC account allows clients to
respond quickly to officers’ requests for additional documents.
Some potential areas for efficiency improvements related to technical issues, specifically a lack
of bandwidth, network outages, and the inability to open multiple attachments from an
application concurrently. Some concerns were also reported with respect to the quality of scanned
and attached documents (e.g., blurry) as well as in standardizing the format in which documents
are uploaded. As an example of an improvement which has already taken place, there is now an
Assisted Decision Making Macro (ADMM) that simplifies an officer’s review process by
standardizing notes and helping guide agents through the steps of processing an application.
Processing officers also noted that because EE pre-screens applications and does a completeness
check, there is a higher quality of applications at the outset of processing than pre-EE.
6.3.1.5. Litigation and Access to Information and Privacy complexities
Although there are clear gains in efficiency when it comes to processing applications, the
electronic nature of the system has introduced greater complexities in the areas of litigation and
ATIP. To address this, litigation risks were identified at the outset of EE, and resources to support
legal and litigation management were allotted in response. Some of these risks were mitigated by
implementing system fixes, or issuing instructions to the field, however ATIP and litigation
trends change over time. For example, interviewees stated that there has been relatively little
litigation of EE over the last four years, and that EE represents only a small amount of the
department’s overall litigation. When EE was introduced, most litigation was due to technical
glitches in the system, but presently the majority of litigation focuses on the hierarchy on which
the system is built. Moreover, due to complex nature of an electronic-based application system, it
is difficult to produce evidence when litigation does occur. For example, interviewees noted that
clients cannot review their uploaded information before submitting it to IRCC, therefore if a
client erroneously uploaded the wrong document, or a technical glitch prevented proper upload of
a document, the client will not know. Additionally interviewees noted that the Certified Tribunal
Record remains complicated to produce, which adds a risk of providing incomplete information
to the court.

46
As mentioned, the electronic nature of the system introduces complexities, and one challenge
with respect to ATIP is that no dedicated resources were identified for the system’s
implementation. Possibly as a consequence, interviewees involved in ATIP revealed that some
efficiency was lost because of the significant increase in page counts and volumes. As noted
above, trends with ATIP change over time; with respect to volumes, EE made up 11% of all
ATIP requests to the department in FY 2017–18. Another issue is that the system generates a new
set of client information each time a client updates their EE profile, which results in a large
increase in the page count (i.e., volume) of ATIP requests. It may be worth noting that three
quarters of ATIP requests enquire on the status of an application, and most of these requests are
placed when the Department does not meet the standard 6 month processing. Moreover there is
an inability to track incoming/outgoing correspondence and provide evidence of what is kept in
GCMS.
6.3.2. Flexibility
Finding: Express Entry has demonstrated flexibility as an application management system through its
ability to make adjustments quickly and to monitor the impact of these adjustments in a timely way.
As mentioned in section 1.2, IRPA provides the legislative authority for Canada’s immigration
program. IRPA contains various provisions that allow the Minister to issue MIs based on the
government’s overall immigration goals. With respect to EE, the Minister has issued MIs for EE
as an application management system,
30
and MIs respecting invitations to apply (ITA) for
permanent residency. MIs as a tool for EE were implemented in response to a desire to shorten
the interval between decisions that shift policy directions and the outcomes resulting from those
shifts. Prior to MIs, regulatory processes took longer to implement which resulted in having to
wait for many years to observe changes to the characteristics of economic PAs.
By virtue of having an "expression of interest system"
31
where candidates are assessed based on a
CRS that may change over time,
32
as well as the relative quickness of MIs, the impact of policy
and program changes can be observed and monitored quickly. For example, in November 2016,
IRCC was able to reduce CRS points assigned for valid offers of arranged employment from 600
points for all candidates to 200 points for candidates with valid offers of arranged employment in
National Occupational Classification occupations beginning with 00 (i.e., senior managers), and
to 50 points for candidates with valid offers of arranged employment in all other valid NOC
occupations. Subsequent to the reduction in job offer points, IRCC was able to see immediate
impacts on the NOC mix of invited candidates. Furthermore, there is some evidence that the
reduction in job offer points encouraged some candidates to present evidence of all of their
qualifications, as prior to this a job offer was a virtual guarantee of selection. Since EE was
implemented, adjustments are able to be made relatively quickly via MIs compared to when
regulatory changes were required.
30
EE Ministerial Instructions include: the economic immigration programs included in EE and associated eligibility criteria; the
electronic submission process a candidate must complete in order to submit an EE profile, and any associated exemptions; how
candidates will be ranked in the EE pool; information on invitation-to-apply draws; time limits for the maximum amount of time a
candidate can be in the EE pool, and if invited, how long they have to submit an application for permanent residence; candidate
information that can be shared with third parties including other government departments; and, how candidates will be notified
about any matter relating to their expression of interest.
31
In an "expression of interest" system, IRCC is able to choose which candidates from the EE pool will receive an invitation to
apply. In a "first-in-first-out" system, all applications are processed based on date of application.
32
For example, prospective applicants are assessed against existing CRS criteria, and if changes are made to the CRS, these
changes are retroactively applied to prospective applicants who are already in the pool.

47
The CRS can also be adapted in terms of adding new types of points. One example of this is the
2017 addition of bonus points for having siblings who are Canadian citizens or permanent
residents of Canada who reside in Canada. The 2017 year-end report noted sibling points were
the most common additional point type.
Further changes impacting flexibility occurred in 2017, when the Immigration and Refugee
Protection Regulations were amended to allow for regulatory changes to be applied to candidates
in the EE pool. Prior to the introduction of this change, separate MIs created distinct and separate
inventories of applications, which overlapped with one another. The 2017 amendment therefore
avoids a potential transition period following a regulatory amendment where invitations would be
issued to apply for EE programs under multiple sets of rules, creating another scenario of
overlapping inventories and mixed characteristics of admitted economic immigrants for a certain
period.
6.3.3. Integrity
Finding: While integrity tools were developed to support Express Entry, risks to system integrity remain
due to the lack of a systematic approach to address existing and emerging integrity issues.
The Department recognized prior to the system's launch that moving to an "Expression of
Interest", electronic, application management system brought new and different risks in
permanent residence lines of business, along with new opportunities to enhance risk
management. Integrity was consequently a key consideration in the authorities and resources
sought and established at the outset, and new tools and mechanisms were introduced to detect
fraud and control risk.
At the launch of EE, various tools were introduced to improve capacity to manage risks. For
example, the launch of a third party authentication portal/process for language and educational
credentials to make verification more straightforward and reliable. The department also launched
quality assurance testing on the EE business rules engine to make sure that MIs and associated
business rules were working as intended (including as changes were made). Additionally, triage
criteria were created and validated to distinguish between complex and non-complex cases.
Further, an integrity process plan for the EE system was developed to identify and prioritize
integrity exercises within each line of business.
However, one central integrity effort that failed to meet its objectives – was the EE Validation
and Verification Process (VVP). The VVP was intended to detect fraud trends and validate the
criteria to triage and share the caseload across the networks, by identifying, assessing, and
mitigating program risk in real-time, while cases were being processed. However, the VVP was
hindered by a number of issues which affected the validity of the results, including an ill-suited
methodology. There was both a lack of oversight and resources allocated for implementation.
When officers identified areas of risks, there was limited action to address them. Overall, the
VVP failed to identify reliable trends and was terminated. While integrity was considered a
shared responsibility across networks and programs and there were particular roles assigned for
the implementation of the VVP exercise, roles and responsibilities for integrity in EE have been
less clear between branches since the VVP was terminated.

48
In the absence of a comprehensive departmental approach to program integrity in EE, the
networks used various mechanisms and internal oversight to manage risks (e.g. Quality
Assurance and training exercises, fraud detection, mission-specific exercises, referrals to Risk
Assessment Units for in-depth verifications and research on situations of concern). There has also
been reliance on increasing officer experience over time. Furthermore, IRCC is currently in the
process of implementing a systematic risk assessment approach which will enable fraud
mitigation and risk management; however at this point the results/outcomes of these activities are
not known and therefore cannot be assessed for the purposes of the evaluation.
The general perspective of interviewees on integrity was that efforts and investments in EE were
insufficient and that roles and responsibilities related to integrity of the EE system were unclear.
In particular, interviewees identified concerns with the validation of qualifications based on
electronic documents and verification of employer references/work experience; the potential for
“job inflation” through “facilitative employers”; and that new risks are introduced whenever CRS
bonus points are added.
Supporting integrity within the EE has not been without success. One of the successes of EE has
been in improving the flow of information across networks; interviewees reported a greater
ability to share and act on information between networks as a result of the electronic nature of the
application management system. This has meant an increased capacity to search for and review
information, share flags, alerts and detected fraud, and assign verification work electronically. It
includes, for example, sharing results of inspections of language testing centres, targeted
exercises on educational transcripts, and flagging issues with employment reference letters. This
enhanced capacity has been further facilitated by concerted communication and collaboration
efforts (e.g., establishing working groups, annual risk assessment officer conferences) in support
of integrity, risk management and the detection and deterrence of fraud.

49
7 Conclusions and recommendations
Summary
The following section summarizes the conclusions from the evaluation and puts forward four
recommendations.
Overall, findings from the evaluation suggest that early economic results for EE PAs are
generally positive in terms of their labour market participation and employment income as well
as the type of occupation in which they are employed. Further, results indicate that EE PAs
generally outperformed their non-EE counterparts during the period under study. For example,
results from the evaluation show that:
• incidence of employment is higher for EE PAs when compared to non-EE PAs overall and
across the four economic programs;
• EE PAs are finding employment more quickly than their non-EE counterparts;
• EE PAs are generally employed in higher skilled occupations, more so than their non-EE
counterparts;
• the average employment income of EE PAs was higher than their non-EE counterparts.
While early economic results were generally positive, it should be noted that the EE system is
designed to screen candidates with the potential to achieve economic success in the Canadian
labour market over the longer term. Nevertheless, early results are encouraging and suggest that
candidates screened through EE are becoming economically established with high employment
rates and employment income.
Monitoring of the system
While the evaluation found EE to be an effective filtering mechanism to screen candidates with a
higher potential for economic integration in Canada, it also found that the CRS had a limited
impact on short-term economic outcomes of EE PAs. Particularly, the skills transferability factors
and spouse factors in the CRS were not found to have clear impact on economic outcomes. These
findings point at the need to continue monitoring the influence of the CRS on economic outcomes
of EE PAs to assess its impact in the longer-term.
Recommendation 1: IRCC should continue to monitor the impact of the CRS on
earnings in the longer term, revalidating and streamlining it as needed, to focus on key
predictors of economic success.
Information gaps
The evaluation found that there were certain gaps in the information provided by candidates
when applying for permanent residence. In particular, while level of education is considered a
key human capital characteristic, it is not a mandatory field in the electronic application and, as a
result, not all candidates invited to apply for permanent residence submit information on their
educational credentials. The lack of this type of data limits the Department’s ability to fully
assess the impact of EE PAs’ level of education and spousal attributes on economic results.
Collecting information on level of education for all economic immigrants, including spouses, will
allow IRCC to monitor and more reliably measure the impact of education on the economic
results of PAs screened in through EE.

50
Recommendation 2: IRCC should collect information on the level of education of all
principal applicants, as well as information related to their spouse.
Management of integrity
At the launch of EE, various tools were introduced (e.g., third party authentication, quality
assurance testing, triage criteria) to improve capacity to detect potential fraud and manage system
risk. However, the EE Validation and Verification Process (VVP), which was intended to be a
central integrity mechanism, was discontinued due to methodology and capacity issues and lack
of coordination. And with diffuse roles and responsibilities relating to the integrity of the EE
system, the departmental approach has relied on officer experience and minimal centralized
oversight as opposed to addressing integrity with a systematic approach as originally intended.
Given the potential for fraud as changes to both the EE system and the CRS are made and as
economic immigration may continue to grow, there is a need for a purposeful approach to
monitoring integrity and emerging risk areas.
Recommendation 3: IRCC should develop and implement a systematic approach to
manage integrity in Express Entry.
Electronic system inefficiencies
EE’s implementation as an electronic application system resulted in efficiencies in application
processing, though the electronic nature of the system introduced some challenges associated
with accessibility of client and application information. For example, clients are not able to
review their supporting documents once they have been uploaded and before submitting to IRCC,
rendering them unable to rectify any errors that may have been made, such as uploading an
incorrect document. In addition, it was noted that the system generates a new set of client
information each time a client updates their EE profile.
Such challenges have in turn led to complications related to litigation and ATIP management -
the complex nature of the electronic application system has made it difficult to produce evidence
when litigation occurs. Additionally, the electronic nature of the system makes it more difficult to
produce a Certified Tribunal Record for the court. With respect to ATIP, issues were identified
with the system’s technical design for extracting profile information. In addition, IRCC has
experienced an increased volume of ATIP requests related to EE applications, which typically
involve large amounts of documentation. These issues highlight an opportunity to address certain
inefficiencies in the electronic system for the benefit of clients and the Department.
Recommendation 4: IRCC should develop and implement methods to:
− Allow Express Entry clients to view their application and uploaded documents prior
to, and after applying; and
− Improve accessibility of GCMS information to support the production of complete
records for operational, litigation and ATIP purposes.

51
Appendix A: The Comprehensive ranking system
Version as of 2017/06/06
Table 10: Comprehensive ranking system— Core Human Capital factors (with spouse maximum
460; without spouse maximum 500 – for all factors)
Age
With accompanying
spouse (maximum 100)
Without accompanying
spouse (maximum 110)
17 years of age or less 0 0
18 years of age 90 99
19 years of age 95 105
20 to 29 years of age 100 110
30 years of age 95 105
31 years of age 90 99
32 years of age 85 94
33 years of age 80 88
34 years of age 75 83
35 years of age 70 77
36 years of age 65 72
37 years of age 60 66
38 years of age 55 61
39 years of age 50 55
40 years of age 45 50
41 years of age 35 39
42 years of age 25 28
43 years of age 15 17
44 years of age 5 6
45 years of age or more 0 0
Level of education
With accompanying
spouse (maximum 140)
Without accompanying
spouse (maximum 150)
Less than Secondary school (high school) credential (1) 0 0
Secondary school (high school) credential (2) 28 30
One-year post-secondary program credential (3) 84 90
Two-year post-secondary program credential (4) 91 98
Post-secondary program credential of three years or
longer (5)
112 120
Two or more post-secondary program credentials (6)
33
119 128
University-level credential at the Master’s level OR an
entry-to-practice professional degree. (7)
34
126 135
University-level credential at the Doctoral level (8) 140 150
33
At least one of these credentials must be issued on completion of a post-secondary program of three years or longer.
34
IRCC only accepts as an entry-to-practice professional degree, those degrees issued in relation to an occupation listed at NOC
Skill level A and for which licensing by a provincial regulatory body is required, in one of the following fields of study: Medicine;
Veterinary Medicine; Dentistry; Podiatry; Optometry; Law; Chiropractic Medicine; and Pharmacy.

52
Official languages proficiency—first official language
Maximum points for each ability (reading, writing, speaking and listening):
32 with a spouse
34 without a spouse
Canadian Language Benchmark (CLB) level per
ability
With accompanying
spouse (maximum 128)
Without accompanying
spouse (maximum 136)
Less than CLB 4 0 0
CLB 4 or 5 6 6
CLB 6 8 9
CLB 7 16 17
CLB 8 22 23
CLB 9 29 31
CLB 10 or more 32 34
Official languages proficiency—second official language
Maximum points for each ability (reading, writing, speaking and listening):
6 with a spouse (up to a combined maximum of 22 points)
6 without a spouse (up to a combined maximum of 24 points)
Canadian Language Benchmark (CLB) level per
ability
With accompanying
spouse (maximum 22)
Without accompanying
spouse (maximum 24)
CLB 4 or less 0 0
CLB 5 or 6 1 1
CLB 7 or 8 3 3
CLB 9 or more 6 6
Canadian Work Experience
With accompanying
spouse (maximum 70)
Without accompanying
spouse (maximum 80)
None or less than a year 0 0
1 year 35 40
2 years 46 53
3 years 56 64
4 years 63 72
5 years or more 70 80
Subtotal—Core Human Capital factors
With a spouse – Maximum 460 points
Without a spouse – Maximum 500 points

53
Table 11: Comprehensive ranking system—Spouse factors (maximum 40)
Level of education
With accompanying
spouse (maximum 10)
Without accompanying
spouse (does not apply)
Less than Secondary school (high school) credential 0 --
Secondary school (high school) credential 2 --
One-year post-secondary program credential 6 --
Two-year post-secondary program credential 7 --
Post-secondary program credential of three years or
longer
8 --
Two or more post-secondary program credentials
35
9 --
University-level credential at the Master’s level OR
an entry-to-practice professional degree
36
10 --
University-level credential at the Doctoral level 10 --
Official languages proficiency - first official language
Canadian Language Benchmark (CLB) level per
ability (reading, writing, listening, speaking)
With accompanying
spouse (maximum 5)
Without accompanying
spouse (does not apply)
CLB 4 or less 0 --
CLB 5 or 6 1 --
CLB 7 or 8 3 --
CLB 9 or more 5 --
Canadian work experience
With accompanying
spouse (maximum 10)
Without accompanying
spouse (does not apply)
None or less than a year 0 --
1 year 5 --
2 years 7 --
3 years 8 --
4 years 9 --
5 years or more 10 --
Subtotal—Core Human Capital + Spouse factors
With a spouse – Maximum 500 points
Without a spouse – Maximum 500 points
35
See footnote 33.
36
See footnote 34.

54
Table 12: Comprehensive ranking system skill—Transferability factors (maximum 100)
Education – maximum 50
With good OL proficiency and a post-secondary
degree
CLB 7 or more on all first
OL abilities, one or more
under 9 (maximum 25)
CLB 9 or more on all four
first OL abilities (maximum
50)
Secondary school (high school) credential or less
37
0 0
Post-secondary program credential of one year or
longer
38
13 25
Two or more post-secondary program
credentials
39
,
40
25 50
With Canadian work experience and a post-
secondary degree
Education + 1 year of
Canadian work
experience (Maximum 25)
Education + 2 years or
more of Canadian work
experience (Maximum 50)
Secondary school (high school) credential or less
41
0 0
Post-secondary program credential of one year or
longer
42
13 25
Two or more post-secondary program credentials
AND at least one of these credentials was issued on
completion of a post-secondary program of three
years or longer
43
25 50
Foreign work experience – maximum 50
With good OL proficiency and foreign work
experience
CLB 7 or more on all first
OL abilities, one or more
under 9 (maximum 25)
CLB 9 or more on all four
first OL abilities
(maximum 50)
No foreign work experience 0 0
1 or 2 years of foreign work experience 13 25
3 years or more of foreign work experience 25 50
With Canadian work experience and foreign work
experience
1 year of Canadian work
experience
(maximum 25)
2 or more years’ Canadian
work experience
(maximum 50)
No foreign work experience 0 0
1 or 2 years of foreign work experience 13 25
3 years or more of foreign work experience 25 50
Certificate of qualification (trade occupations)
with good OL proficiency and certificate of
qualification
CLB 5 or more on all first
OL abilities, one or more
under 7 (maximum 25)
CLB 7 or more on all four
first OL abilities
(maximum 50)
With a certificate of qualification 25 50
Subtotal — Core Human Capital + Spouse + Transferability factors
With a spouse – Maximum 600 points
Without a spouse – Maximum 600 points
37
For levels 1 and 2 in “Level of Education” section.
38
For levels 3, 4 and 5 in “Level of Education” section.
39
See footnote 33.
40
For levels 6, 7 and 8 in “Level of Education” section.
41
See footnote 37.
42
See footnote 38.
43
See footnote 40.

55
Table 13: Comprehensive ranking system—Additional points
Additional points With accompanying
spouse (maximum 600)
Without accompanying
spouse (maximum 600)
With a valid job offer in NOC 00 occupations
(e.g. senior executives)
200 200
With a valid job offer in other occupations 50 50
1 or 2 year post-secondary credential 15 15
3 year or more post-secondary credential 30 30
Interaction of English and French Proficiency CLB 4 in English or less on
one or more OL abilities
15
CLB 5 or more in English on all
four OL abilities
30
CLB 7 or more in French on all four OL
abilities
44
15 30
With siblings in Canada (either candidate's or
spouse's)
15 15
With a Provincial/Territorial Nomination 600 600
Total — Core Human Capital + Spouse + Transferability + Additional points
With a spouse – Maximum 1200 points
Without a spouse – Maximum 1200 points
44
Required CLB levels can be obtained on either first or second OL assessed.

56
Appendix B: Socio-demographic profiles
Table 14: Non-express entry principal applicants and admissions
Profile
All PAs -
2014 cohort
(n=48,830)
Non-EE PAs
(n=117,260)
Non-EE
2015
Admissions
(n=46,002)
Non-EE
2016
Admissions
(n=30,247)
Non-EE
2017
Admissions
(n=18,545)
Non-EE
2018
Admissions
(n=22,466)
Year of admission
2015 n/a 39.2% 100.0% -- -- --
2016 n/a 25.8% -- 100.0% -- --
2017 n/a 15.8% -- -- 100.0% --
2018 n/a 19.2% -- -- -- 100.0%
Program
CEC 29.0% 11.3% 17.0% 15.3% 4.0% 0.3%
PNP 43.0% 64.4% 44.8% 53.8% 89.5% 98.1%
FST 0.1% 0.2% 0.4% 0.2% 0.0% 0.0%
FSW 27.9% 24.1% 37.8% 30.7% 6.5% 1.6%
Age
18 to 19 years of age 0.0% -- -- -- -- --
20 to 29 years of age 32.1% 32.8% 31.8% 27.4% 34.0% 41.2%
30 to 34 years of age 27.4% 27.3% 29.8% 29.3% 23.7% 22.3%
35 to 39 years of age 18.1% 19.1% 19.6% 21.4% 18.0% 15.9%
40 to 44 years of age 10.8% 11.0% 10.1% 12.1% 12.2% 10.2%
45 years of age or more 11.6% 9.8% 8.7% 9.8% 12.1% 10.4%
Gender
Female 34.3% 34.9% 33.8% 35.2% 36.2% 35.4%
Male 65.7% 65.1% 66.2% 64.8% 63.8% 64.6%
Education
None 4.5% 0.9% 2.2% 0.2% 0.0% 0.0%
Secondary or less 4.7% 6.3% 4.5% 5.9% 8.1% 8.7%
Non-University studies
(incl. trades)
19.5% 20.1% 16.0% 18.8% 24.7% 26.4%
Bachelor's Degree (incl.
Post-grad, no degree)
44.0% 44.0% 45.4% 45.7% 41.1% 39.8%
Master's Degree 23.3% 23.3% 28.5% 26.3% 23.6% 22.8%
Doctorate - Ph D 4.0% 4.0% 3.3% 2.7% 2.0% 2.0%
Missing 0.0% 0.0% 0.0% 0.4% 0.4% 0.3%
Knowledge of official languages
English 92.9% 94.8% 93.6% 95.5% 95.0% 96.1%
French 0.1% 0.2% 0.1% 0.2% 0.2% 0.2%
English and French 3.6% 3.0% 3.4% 3.0% 2.7% 2.4%
Neither 3.3% 1.9% 2.8% 1.1% 2.0% 1.3%
Not stated -- 0.1% 0.0% 0.2% 0.2% 0.1%
Previous TR status
No 34.9% 37.8% 44.1% 45.2% 31.2% 20.3%
Yes 65.1% 62.2% 55.9% 54.8% 68.8% 79.7%
Previous work permit
No 36.1% 38.8% 45.7% 46.0% 31.6% 20.8%
Yes 63.9% 61.2% 54.3% 54.0% 68.4% 79.2%
Previous study permit
No 70.5% 69.2% 73.6% 76.5% 66.4% 52.8%
Yes 29.5% 30.8% 26.4% 23.5% 33.6% 47.2%

57
Profile
All PAs -
2014 cohort
(n=48,830)
Non-EE PAs
(n=117,260)
Non-EE
2015
Admissions
(n=46,002)
Non-EE
2016
Admissions
(n=30,247)
Non-EE
2017
Admissions
(n=18,545)
Non-EE
2018
Admissions
(n=22,466)
Top 10 countries of citizenship
1 India:
26%
India:
27.7%
India:
29.2%
India:
25.4%
India:
24.9%
India:
30.0%
2 Philippines:
14.4%
Philippines:
15.6%
Philippines:
13.8%
Philippines:
17.4%
China:
19.8%
China:
20.2%
3 China:
11.4%
China:
14.9%
China:
10.7%
China:
14.4%
Philippines:
18.8%
Philippines:
14.4%
4 Iran:
6.5%
Pakistan:
3.7%
Iran:
5.8%
Pakistan:
4.5%
Korea:
3.2%
Nigeria:
3.9%
5 Pakistan:
3.6%
Iran:
3.5%
Pakistan:
4.2%
Korea:
2.7%
Pakistan:
2.7%
Korea:
3.7%
6 UK:
3.6%
Korea:
3.0%
UK:
2.9%
UK:
2.7%
Nigeria:
2.6%
Pakistan:
2.1%
7 Korea:
3.3%
Nigeria:
2.7%
Korea:
2.7%
Nigeria:
2.5%
Bangladesh:
2.3%
Iran:
1.7%
8 Ireland:
2.2%
UK:
2.4%
Nigeria:
2.3%
Iran:
2.5%
UK:
1.8%
Ukraine:
1.5%
9 USA:
2.2%
Bangladesh:
19%
Bangladesh:
2.0%
Bangladesh:
2.1%
Ukraine:
1.8%
UK:
1.3%
10 Nigeria:
2.1%
Ukraine:
1.4%
USA:
1.7%
Ukraine:
1.6%
Iran:
1.2%
Bangladesh:
1.2%
Other 24.9% 23.3% 24.7% 24.2% 20.8% 19.9%
Province of intended destination
Nova Scotia 1.8% 2.1% 2.0% 2.3% 2.3% 1.9%
New Brunswick 1.6% 2.0% 1.5% 2.4% 2.5% 2.2%
Prince Edward Island 1.0% 1.5% 0.7% 1.7% 2.3% 2.0%
Newfoundland and
0.6% 0.9% 0.7% 0.8% 1.2% 1.2%
Ontario 36.4% 28.4% 38.7% 32.1% 16.0% 12.4%
Manitoba 10.6% 14.5% 10.1% 14.0% 21.0% 18.6%
Saskatchewan 8.9% 12.7% 9.1% 11.4% 18.1% 17.3%
Alberta 22.9% 21.8% 21.1% 19.8% 21.0% 26.4%
British Columbia 15.7% 15.8% 15.8% 15.2% 14.8% 17.2%
Yukon 0.3% 0.3% 0.2% 0.2% 0.4% 0.5%
Northwest Territories 0.1% 0.2% 0.1% 0.1% 0.2% 0.3%
Nunavut 0.0% 0.0% 0.0% -- -- --
Top 10 NOC2
1 21: 14.9% 21: 14.3% 21: 20.5% 21: 14.5% 63: 12.8% 63: 15.8%
2 63: 9.8% 63: 10.3% 63: 8.2% 01-05: 7.9% 21: 7.8% 21: 6.5%
3 40: 5.9% 22: 6% 11: 6.7% 63: 7.7% 67: 6.4% 12: 5.6%
4 01-05: 5.8% 01-05: 5.6% 01-05: 6.5% 22: 7.2% 72: 5.2% 06: 5.2%
5 22: 5.7% 11: 5.1% 22: 6.2% 11: 6.2% 22: 5.1% 75: 5.1%
6 72: 5.0% 67: 4.7% 72: 4.6% 67: 5.3% 12: 4.7% 62: 4.9%
7 12: 4.6% 72: 4.6% 40: 4.5% 72: 4.9% 01-05: 3.5% 22: 4.8%
8 31: 4.4% 12: 4.6% 12: 4.1% 12: 4.5% 65: 3.4% 67: 4.7%
9 11: 4.1% 40: 3.2% 67: 3.7% 31: 3.3% 62: 3.3% 65: 3.7%
10 67: 3.2% 06: 3.0% 31: 3.3% 40: 3.0% 75: 3.2% 72: 3.7%
Other 36.4% 38.7% 26.3% 35.5% 44.5% 39.9%

58
Profile
All PAs -
2014 cohort
(n=48,830)
Non-EE PAs
(n=117,260)
Non-EE
2015
Admissions
(n=46,002)
Non-EE
2016
Admissions
(n=30,247)
Non-EE
2017
Admissions
(n=18,545)
Non-EE
2018
Admissions
(n=22,466)
Top 10 NOC4
1 6322: 4.2% 6311: 4.8% 6311: 3.4% 6711: 4.4% 6311: 6.3% 6311: 9.3%
2 6311: 3.7% 6711: 3.8% 2174: 3.2% 6322: 3.1% 6711: 5.1% 7511: 4.8%
3 2174: 2.4% 6322: 3.4% 6322: 3.1% 6311: 2.7% 6322: 4.3% 6322: 3.9%
4 6711: 2.4% 2171: 2.3% 6711: 3.0% 2171: 2.0% 7511: 2.8% 6211: 3.7%
5 2171: 2.4% 7511: 2.3% 2171: 2.9% 1111: 2.0% 6211: 1.9% 6711: 3.7%
6 4011: 2.2% 2174: 2.0% 2173: 2.6% 4011: 1.9% 2171: 1.6% 0621: 2.5%
7 3012: 2.1% 6211: 1.7% 3012: 2.4% 7511: 1.8% 7237: 1.5% 0631: 2.2%
8 4021: 2.1% 4011: 1.6% 2132: 2.3% 2131: 1.7% 0621: 1.5% 2171: 1.9%
9 0213: 1.8% 2173:1.6% 4011: 2.2% 2174: 1.7% 0631: 1.3% 1241: 1.4%
10 6211: 1.8% 3012: 1.6% 2131: 1.8% 2172: 1.6% 1311: 1.3% 9462: 1.4%
Other 74.9% 74.7% 73.0% 77.1% 72.4% 65.3%
NOC skill level
0 - Managerial 13.1% 14.6% 13.2% 17.6% 14.5% 13.3%
A - Professionals 33.7% 28.9% 39.9% 31.1% 16.9% 13.3%
B - Skilled and Technical 37.8% 36.2% 32.9% 34.5% 39.8% 42.3%
C - Intermediate and
Clerical
6.2% 9.6% 6.0% 8.2% 13.0% 16.2%
D - Elemental and
Labourers
4.0% 5.8% 4.4% 6.4% 8.2% 5.8%
Other
5.1% 4.9% 3.5% 2.2% 7.7% 9.1%
NOC skill type
0 - Management
occupations
0.8% 1.1% 1.2% 1.6% 0.8% 0.4%
1 - Business, finance and
administration
occupations
14.6% 16.5% 17.8% 19.4% 13.7% 12.6%
2 - Natural and applied
sciences and related
occupations
23.1% 21.2% 27.9% 22.3% 13.5% 12.2%
3 - Health occupations
8.9% 6.6% 8.2% 7.4% 4.7% 3.6%
4 - Occupations in
education, law and social,
community and
government services
9.4% 6.3% 7.6% 6.5% 5.1% 4.3%
5 - Occupations in art,
culture, recreation and
sport
2.0% 1.6% 1.8% 2.2% 1.0% 0.8%
6 - Sales and service
occupations
21.2% 24.1% 18.6% 19.8% 30.4% 36.0%
7 - Trades, transport and
equipment operators and
related occupations
9.3% 10.0% 8.4% 10.2% 11.4% 11.7%
8 - Natural resources,
agriculture and related
production occupations
1.1% 1.4% 1.0% 1.5% 1.7% 1.8%
9 - Occupations in
manufacturing and utilities
2.1% 3.0% 2.3% 3.2% 3.9% 3.5%
Other 7.4% 8.3% 5.3% 5.9% 13.8% 13.2%
Source: GCMS

59
Table 15: Express Entry principal applicants and admissions
Profile
All PAs -
2014 cohort
(n=48,830)
EE PAs
(n=117,260)
EE 2015
Admissions
(n=46,002)
EE 2016
Admissions
(n=30,247)
EE 2017
Admissions
(n=18,545)
EE 2018
Admissions
(n=22,466)
Year of admission
2015 n/a 5.0% 100.0% -- -- --
2016 n/a 16.0% -- 100.0% -- --
2017 n/a 33.8% -- -- 100.0% --
2018 n/a 45.2% -- -- -- 100.0%
Program
CEC 29.0% 42.2% 59.9% 27.8% 53.3% 37.0%
PNP 43.0% 17.4% 5.7% 22.9% 17.8% 16.5%
FST 0.1% 2.4% 13.8% 4.8% 1.9% 0.7%
FSW 27.9% 37.9% 20.6% 44.5% 27.0% 45.8%
Age
18 to 19 years of age 0.0% 0.0% -- -- 0.0% 0.0%
20 to 29 years of age 32.1% 46.4% 34.4% 42.2% 51.0% 45.8%
30 to 34 years of age 27.4% 33.0% 34.5% 34.5% 29.9% 34.6%
35 to 39 years of age 18.1% 13.9% 17.7% 14.0% 12.3% 14.6%
40 to 44 years of age 10.8% 4.2% 7.6% 5.1% 4.1% 3.5%
45 years of age or more 11.6% 2.5% 5.9% 4.2% 2.7% 1.5%
Gender
Female 34.3% 37.0% 31.2% 33.7% 35.9% 39.7%
Male 65.7% 63.0% 68.8% 66.3% 64.1% 60.3%
Education
None 4.5% -- -- -- -- --
Secondary or less 4.7% 9.0% 52.4% 19.7% 7.1% 1.8%
Non-University studies
(incl. trades)
19.5% 6.9% 9.2% 7.9% 7.8% 5.7%
Bachelor's Degree (incl.
Post-grad, no degree)
44.0% 43.1% 20.4% 34.0% 47.6% 45.2%
Master's Degree 23.3% 37.6% 16.3% 34.2% 34.2% 43.7%
Doctorate - Ph D 4.0% 3.4% 1.7% 4.1% 3.3% 3.5%
Missing 0.0% 0.1% 0.0% 0.0% 0.1% 0.1%
Knowledge of official languages
English 92.9% 95.7% 97.5% 95.6% 96.0% 95.3%
French 0.1% 0.5% 0.3% 0.6% 0.4% 0.4%
English and French 3.6% 3.8% 2.2% 3.8% 3.5% 4.3%
Neither 3.3% -- -- -- -- --
Not stated -- -- -- -- -- --
Previous TR status
No 34.9% 34.4% 4.2% 22.7% 26.7% 47.7%
Yes 65.1% 65.6% 95.8% 77.3% 73.3% 52.3%
Previous work permit
No 36.1% 35.7% 4.6% 23.8% 27.9% 49.1%
Yes 63.9% 64.3% 95.4% 76.2% 72.1% 50.9%
Previous study permit
No 70.5% 60.9% 74.8% 63.8% 52.3% 64.8%
Yes 29.5% 39.1% 25.2% 36.2% 47.7% 35.2%

60
Profile
All PAs -
2014 cohort
(n=48,830)
EE PAs
(n=117,260)
EE 2015
Admissions
(n=46,002)
EE 2016
Admissions
(n=30,247)
EE 2017
Admissions
(n=18,545)
EE 2018
Admissions
(n=22,466)
Top 10 countries of citizenship
1
India:
26%
India:
40.4%
Philippines:
23.7%
India:
31.1%
India:
41.9%
India:
44.6%
2
Philippines:
14.4%
China:
9.2%
India:
21.2%
China:
9.4%
China:
11.0%
China:
8.3%
3
China:
11.4%
Nigeria:
4.6%
UK:
6.8%
Philippines:
7.1%
Nigeria:
3.9%
Nigeria:
6.0%
4
Iran:
6.5%
Philippines:
3.9%
Ireland:
6.0%
UK:
5.5%
UK:
3.3%
Pakistan:
3.4%
5
Pakistan:
3.6%
UK:
3.7%
China:
4.7%
Ireland:
3.9%
USA:
2.9%
UK:
3.0%
6
UK:
3.6%
Pakistan:
2.7%
Korea:
3.6%
USA:
3.1%
Philippines:
2.8%
Brazil:
2.2%
7
Korea:
3.3%
USA:
2.5%
USA:
3.1%
Nigeria:
2.8%
Pakistan:
2.3%
USA:
2.0%
8
Ireland:
2.2%
Ireland:
2.4%
Australia:
1.6%
France:
2.6%
Ireland:
2.2%
Iran:
1.8%
9
USA:
2.2%
Korea:
1.9%
France:
1.4%
Korea:
2.3%
Korea:
2.0%
Ireland:
1.5%
10
Nigeria:
2.1%
Brazil:
1.9%
Poland:
1.4%
Pakistan:
2.2%
Brazil:
1.9%
Korea:
1.5%
Other 24.9% 26.8 26.7% 29.9% 25.6% 25.6%
Province of intended destination
Nova Scotia 1.8% 3.0% 1.5% 4.2% 2.8% 2.9%
New Brunswick 1.6% 1.3% 0.2% 1.1% 1.6% 1.4%
Prince Edward Island 1.0% 0.9% 0.1% 1.2% 1.2% 0.6%
Newfoundland and
Labrador
0.6% 0.3% 0.3% 0.2% 0.3% 0.3%
Ontario 36.4% 56.8% 24.7% 41.2% 57.5% 65.3%
Manitoba 10.6% 0.9% 0.9% 0.8% 0.8% 1.1%
Saskatchewan 8.9% 2.8% 1.4% 4.3% 3.1% 2.3%
Alberta 22.9% 13.5% 52.2% 24.1% 11.8% 6.8%
British Columbia 15.7% 20.3% 18.4% 22.7% 20.7% 19.4%
Yukon 0.3% 0.1% 0.0% 0.0% 0.0% 0.1%
Northwest Territories 0.1% 0.1% 0.1% 0.1% 0.1% 0.0%
Nunavut 0.0% 0.0% 0.0% 0.0% 0.0% 0.0%
Top 10 NOC2
1 21: 14.9% 21: 25.2% 63: 35.2% 21: 23.0% 21: 24.8% 21: 27.7%
2 63: 9.8% 11: 9.4% 21: 12.9% 63: 11.7% 22: 8.9% 11: 10.9%
3 40: 5.9% 12: 7.9% 72: 8.8% 11: 8.5% 12: 8.7% 01-05: 9.0%
4 01-05: 5.8% 63: 7.7% 62: 5.5% 12: 6.6% 11: 8.6% 12: 8.2%
5 22: 5.7% 22: 7.5% 12: 4.8% 22: 6.6% 01-05: 6.4% 22: 7.0%
6 72: 5.0% 01-05: 7.2% 22: 4.6% 72: 5.7% 63: 6.4% 40: 5.2%
7 12: 4.6% 40: 4.8% 11: 4.3% 01-05: 5.4% 62: 4.9% 63: 4.2%
8 31: 4.4% 62: 4.5% 06: 2.9% 40: 4.6% 40: 4.6% 62: 4.1%
9 11: 4.1% 06: 3.7% 52: 2.8% 62: 4.6% 06: 4.1% 06: 3.5%
10 67: 3.2% 72: 3.4% 40: 2.8% 06: 3.5% 72: 3.3% 31: 3.4%
Other 36.4% 18.6% 15.5% 20.0% 19.2% 16.7%
Top 10 NOC4
1 6322: 4.2% 2171: 5.9% 6311: 17.3% 2171: 5.4% 2171: 5.9% 2171: 6.4%
2 6311: 3.7% 2173: 5.1% 6322: 14.5% 6322: 4.8% 2173: 4.9% 2173: 6.0%
3 2174: 2.4% 2174: 4.4% 6211: 4.2% 6311: 4.5% 2174: 4.7% 2174: 4.4%
4 6711: 2.4% 6311: 3.2% 2171: 2.4% 2174: 4.4% 6311: 2.5% 1111: 2.8%
5 2171: 2.4% 6322: 2.7% 2174: 2.4% 2173: 3.9% 1241: 2.4% 1241: 2.5%
6 4011: 2.2% 1111: 2.4% 2173: 2.2% 4011: 3.0% 4011: 2.1% 1123: 2.5%
7 3012: 2.1% 4011: 2.2% 5241: 2.0% 6211: 2.2% 1111: 2.1% 1112: 2.2%
8 4021: 2.1% 1241: 2.2% 4011: 1.8% 1111: 2.1% 6322: 2.1% 4011: 2.1%
9 0213: 1.8% 1123: 2.2% 0631: 1.3% 1123: 1.9% 1123: 2.0% 1122: 1.8%
10 6211: 1.8% 1112: 1.9% 7271: 1.1% 5241: 1.9% 5241: 2.0% 0124: 1.8%
Other 74.9% 67.8 50.8% 65.9% 69.2% 67.5%

61
Profile
All PAs -
2014 cohort
(n=48,830)
EE PAs
(n=117,260)
EE 2015
Admissions
(n=46,002)
EE 2016
Admissions
(n=30,247)
EE 2017
Admissions
(n=18,545)
EE 2018
Admissions
(n=22,466)
NOC skill level
0 - Managerial 13.1% 13.3% 7.6% 11.5% 13.0% 14.8%
A - Professionals 33.7% 47.0% 24.5% 43.6% 45.2% 52.1%
B - Skilled and Technical 37.8% 39.6% 67.8% 44.7% 41.7% 33.1%
C - Intermediate and
Clerical
6.2% 0.0% 0.1% -- 0.0% 0.0%
D - Elemental and
Labourers
4.0% 0.0% 0.0% 0.0% 0.0% 0.0%
Other 5.1% 0.1% -- 0.2% 0.1% 0.0%
NOC skill type
0 - Management
occupations
0.8% 1.1% 0.8% 1.1% 1.2% 1.1%
1 - Business, finance and
administration
occupations
14.6% 24.0% 11.8% 20.3% 23.5% 27.1%
2 - Natural and applied
sciences and related
occupations
23.1% 34.5% 18.1% 30.8% 35.5% 36.8%
3 - Health occupations 8.9% 4.8% 3.5% 5.0% 4.8% 4.8%
4 - Occupations in
education, law and social,
community and
government services
9.4% 9.4% 5.7% 9.1% 9.1% 10.2%
5 - Occupations in art,
culture, recreation and
sport
2.0% 3.7% 3.4% 3.7% 3.9% 3.5%
6 - Sales and service
occupations
21.2% 15.9% 43.5% 19.7% 15.4% 11.8%
7 - Trades, transport and
equipment operators and
related occupations
9.3% 5.3% 11.8% 8.2% 5.2% 3.7%
8 - Natural resources,
agriculture and related
production occupations
1.1% 0.5% 0.8% 1.0% 0.5% 0.3%
9 - Occupations in
manufacturing and utilities
2.1% 0.7% 0.4% 0.7% 0.9% 0.7%
Other 7.4% 0.1% -- 0.2% 0.1% 0.0%

62
Appendix C: Evaluation matrix for the evaluation of IRCC’s
Express Entry system
Questions:
The program profile will provide a description of the clients who applied through Express Entry
(EE), were admitted through EE, admitted through the previous regime and clients who were not
selected in the draw (i.e., still in the pool) for comparison
Indicators:
• Number of economic immigrants admitted by immigration category (for FSWP, FSTP, CEC
and PNP) and selection regime (including Express Entry system and previous regime, CRS
version)
• Socio-demographic profile of economic immigrants, at different stages of the process
(including applicants, pool candidates, invited applicants, and those admitted as PRs through
EE) and economic immigrants not admitted through EE
• Geographic distribution of economic immigrants admitted through EE, and economic
immigrants not admitted through EE
• CRS score profile
• PRs admitted under EE who were previously TRs, by TR category (e.g., International
students, workers)
• Distribution of intended/primary occupation and previous occupation
Methodology:
• Analysis of Administrative Data (GCMS and IMDB stats), including CRS scores.
• Document Review
Question 1:
To what extent are economic immigrants screened under Express Entry system becoming
established economically? (excluding PNP base applications and caregivers)
Indicators:
− PA, spouse and dependant (separately) economic outcomes over time (incidence, average
and median), by economic immigration category and CRS version
− Social Assistance incidence rates by economic immigration category and CRS version
− Employment earnings of economic immigrants relative to CRS version, CRS score, and
Canadian average
− Family income over time (average and median)
− Impact of spouse and spouse characteristics (when available) on PA earnings
− Earnings relative to each respective industry and occupation
− PAs perception of their situation in Canada (e.g., economic situation and decision to
immigrate)
− Challenges that economic PAs face when integrating into the workforce
− Percentage of PAs employed in intended occupation
− Percentage of PAs working at a level commensurate with their education

63
Methodology:
− Analysis of Administrative Data
− IMDB
− EE Survey
Question 2:
Are the economic Immigrants screened using the Express Entry system performing better
than those admitted outside of the Express Entry system?
Indicators:
− Number and percentage of federal economic immigrants who are employed, by economic
immigration category, intended NOC, and CRS version (under Express Entry system and
previous regime)
− Employment earnings (average earnings), by economic immigration category, intended
NOC, and CRS version
− Employment earnings (incidence rate and average) compared with the Canadian rate and
average, by economic immigration category, intended NOC, and CRS version
− Number and percentage of federal economic immigrants who are in the middle income
range or above, by economic immigration category and CRS version
− Average wages of economic immigrants that are equal to or more than occupational average
wage, by economic immigration category, CRS version, and NOC
Methodology:
− Analysis of administrative data
− Interviews
− EE Survey
Question 3:
To what extent has the EE system enabled the economic programs to be responsive to labour
market and regional needs?
Indicators:
− Evidence of labour market and regional needs
− Evidence that identified labour market shortages/oversupply are being
filled/overfilled/exacerbated by economic immigrants admitted (e.g., alignment of labour
market shortages and employment profile of PAs admitted)
− Number and percentage of PAs with a job offer
− Number and percentage of PAs employed in intended occupation (for those who have been
identified by employers or PTs)
− Stakeholders’ views on the responsiveness of the EE system to labour market demands
− Extent and ways P/Ts use EE (PNP base vs. EE)
− Stakeholders’ views on challenges and successes associated with the implementation of the
EE system
− PTs and Employers views on the extent to which Express Entry participants are fulfilling
their labour market needs
− Flexibility of EE system (i.e., adjustments made)
− Number/type of and reasons for changes in the CRS version/EE system since its
implementation
− Stakeholders views on the flexibility in selection and application management (incl. timeliness)

64
Methodology:
− Interviews
− Document review
− EE Survey
− Case studies
− Employer Survey
Question 4:
How has the Express Entry system impacted the profile of admissions under the economic
programs (FSW, CEC, FSTP, PNP)?
Indicators:
− Profile of PAs (human capital attributes and NOC information) and impact of program
hierarchy (heterogeneity of applicants; evidence of gaps and/or changing profile of PAs
admitted)
− Geographic distribution of immigrants admitted under Express Entry vs. previous regime
− Proportion of economic immigrants who were previously temporary residents under Express
Entry vs. previous regime
Methodology:
− Document review
− Analysis of administrative data
− Interviews
Question 5:
To what extent are the Express Entry system and Economic Programs contributing to the
Official Language Minority Communities (OLMC) initiative objectives?
Indicators:
− Trends over time of French-speaking candidates by economic immigration category and
selection regime (including Express Entry system and previous regime, CRS version)
− Impact of French CRS points on the number of French-speaking candidates invited
− Intended destination of French-speaking immigrants
− Number and nature of activities targeting an increase in French-speaking admissions via
Express Entry (e.g., changes to CRS, engagement activities led by IRCC’s offices abroad
and ELN )
Methodology:
− Document review
− Analysis of administrative data
− Interviews
− EE survey

65
Question 6:
What is the impact of the Express Entry system on the gender distribution and outcomes
within the Economic program?
Indicators:
− CRS score distribution by gender
− Gender profile of economic immigrants by economic immigration category and selection
regime (including Express Entry system and previous regime, CRS version)
− Economic outcomes (incidence of, average and median employment earnings, social
assistance rate) of economic immigrants by gender
Methodology:
− Document review
− EE Survey
− IMDB
Question 7:
What have been the early impacts of Express Entry on efficiency, flexibility and integrity on
the economic immigration programs?
Indicators:
− Average processing time of EE and pre-EE applications by economic immigration category
− Proportion of applications finalized within the EE established service standards by economic
immigration category to meet admissions targets
− Perceptions of processing officers on application processing efficiency (EE/pre-EE, impact
of automation, wastage in PR application processing)
− Perceptions of impact of EE on litigation and ATIP.
− Evidence of flexibility of EE
− Evidence of integrity measures in place (e.g., QA mechanisms in place, assessment of risks)
− Number and percentage APRs refused (EE/pre-EE) and reasons for refusals
Methodology:
− Document review
− Analysis of administrative data
− Interviews
− Focus groups/surveys (as needed)
− Ops and Corporate sector input/reports

66
Appendix D: Regression results on employment income
Linear regression
Table 16: Linear regression for the log of employment income in 2017 for Express Entry and non-
Express Entry principal applicants – 2015 and 2016 cohorts, model 1
Factors Model 1 coefficient
Constant 10.557***
Express Entry (ref. No) 0.198***
Model information
n 66590
df 1
F 686.81***
R Square 0.01
Table 17: Linear regression for the log of employment income in 2017 for Express Entry and non-
Express Entry principal applicants – 2015 and 2016 cohorts, model 2
Factors Model 2 coefficient
Constant 10.625***
Express Entry (ref. No) 0.084***
Immigration program (ref. FSW)
CEC -0.032**
FST -0.017
PNP -0.018
Year of admission (ref. 2015)
2016 -0.096***
Age group (ref. 45 years of age or more)
20 to 29 years of age 0.02
30 to 34 years of age 0.034*
35 to 39 years of age 0.038**
40 to 44 years of age 0.035*
Gender (ref. Female)
Male 0.247***
Education (ref. Ph.D)
Secondary or less -0.143***
Non-university studies (incl. trades) -0.158***
Bachelor's degree (incl. Post-grad no degree) -0.09***
Master's degree -0.057**
Mother tongue (ref. Other)
English or French 0.077**
Intended province of destination (ref. Ontario)
Atlantic -0.097***
Manitoba and Saskatchewan -0.127***
Alberta -0.097***
British Columbia -0.067***
NOC skill level (ref. skill level A)
Skill level 0 -0.026*
Skill level B -0.134***

67
Factors Model 2 coefficient
NOC skill type (ref. NOC 00)
Skill type 1 -0.305***
Skill type 2 -0.2***
Skill type 3 -0.509***
Skill type 4 -0.511***
Skill type 5 -0.401***
Skill type 6 -0.47***
Skill type 7 -0.344***
Skill type 8 -0.357***
Skill type 9 -0.282***
Amount of wages as a TR (ref. 0 / did not work in Canada prior to PR)
1$ to 24,999$ -0.001
25,000$ to 49,999$ 0.271***
50,000$ to 74,999$ 0.607***
75,000$ to 99,999$ 0.831***
100,000$ or more 1.252***
Country of Citizenship (ref. India)
Philippines 0.197***
China -0.103***
United Kingdom 0.237***
Ireland 0.109***
USA 0.321***
South Korea -0.151***
Nigeria -0.024
France 0.132***
Australia 0.193***
Iran -0.172***
Pakistan -0.157***
Bangladesh -0.285***
Other 0.08***
Model information
n 65815
df 48
F 607.76***
R Square 0.307
*p<0.05; ** p<0.01; *** p<0.001
Source: Wages and Salaries, 2017

68
Regression decomposition
Regression decomposition of the earnings gap between Express Entry and non-Express Entry
principal applications
Total difference in earnings between EE and non-EE: 0.198
Explained difference: 0.114
Explained as percentage of the total difference: 57.80%
Percentage of the explained component attributable to covariates
Immigration Program: -1.80%
Year of admission: -33.40%
Gender: -0.40%
Intended province of destination: 2.90%
Age group: -0.50%
Education: -7.20%
Mother tongue: 7.70%
Skill level of the intended occupation: -10.10%
Skill type of the intended occupation: -12.70%
Earnings as a TR: 127.70%
Country of citizenship: 27.60%

69
Linear regression
Table 18: Linear regression for the log of employment income in 2017 for Express Entry and non-
Express Entry principal applicants by immigration program – 2015 and 2016 cohorts
Factors
CEC
coefficient
FST
coefficient
FSW
coefficient
PNP
coefficient
Constant 11.155*** 9.451*** 10.726*** 10.718***
Express Entry (ref. No) 0.023 0.036 0.123*** 0.106***
Year of admission (ref. 2015)
2016 -0.053*** -0.002 -0.129*** -0.106***
Age group (ref. 45 years of age or more)
20 to 29 years of age -0.054* 0.055 -0.01 0.012
30 to 34 years of age -0.039 0.123* -0.002 0.024
35 to 39 years of age -0.023 0.051 -0.001 0.031*
40 to 44 years of age -0.006 -0.018 0.004 0.028
Gender (ref. Female)
Male 0.186*** 0.449*** 0.26*** 0.244***
Education (ref. Ph.D)
Secondary or less -0.058 0.163 -0.098*** -0.145***
Non-university studies (incl. trades) -0.165*** 0.198 -0.164*** -0.157***
Bachelor's degree (incl. Post-grad no degree) -0.051 0.228 -0.097*** -0.093***
Master's degree -0.021 -- -0.07*** -0.055**
Mother tongue (ref. Other)
English or French 0.058** 0.071 0.113*** 0.11***
Intended Province of Destination (ref. Ontario)
Atlantic -0.061 0.114 -0.064** -0.119***
Manitoba and Saskatchewan -0.094** 0.22* -0.161*** -0.156***
Alberta -0.065*** 0.12* -0.093*** -0.122***
British Columbia -0.032* 0.001 -0.058*** -0.099***
NOC skill level (ref. skill level A)
Skill level 0 0.001 -- -0.031* -0.036**
Skill level B -0.147*** -- -0.119*** -0.127***
NOC skill type (ref. NOC 00)
Skill type 1 -0.562*** -- -0.259*** -0.292***
Skill type 2 -0.511*** -- -0.166*** -0.193***
Skill type 3 -0.522*** -- -0.511*** -0.524***
Skill type 4 -0.696*** -- -0.509*** -0.514***
Skill type 5 -0.547*** -- -0.531*** -0.544***
Skill type 6 -0.721*** -- -0.491*** -0.479***
Skill type 7 -0.615*** -- -0.313*** -0.305***
Skill type 8 -0.579*** -- -0.209* -0.321***
Skill type 9 -0.535*** -- -0.241*** -0.263***
Amount of wages as a TR (ref. 0 / did not work in Canada prior to PR)
$1 to $24,999 -0.154* -0.035 -0.056*** -0.018
$25,000 to $49,999 0.105 0.121* 0.267*** 0.279***
$50,000 to $74,999 0.455*** 0.485*** 0.564*** 0.581***
$75,000 to $99,999 0.694*** 0.688*** 0.769*** 0.797***
$100,000 or more 1.097*** 1.055*** 1.22*** 1.234***

70
Factors
CEC
coefficient
FST
coefficient
FSW
coefficient
PNP
coefficient
Country of Citizenship (ref. India)
Philippines 0.153*** 0.262*** 0.155*** 0.201***
China -0.098*** -0.327 -0.056*** -0.093***
United Kingdom 0.092** 0.369*** 0.132*** 0.153***
Ireland 0.068* 0.193 -0.045 -0.016
USA 0.148*** -0.109 0.264*** 0.262***
South Korea -0.14*** -0.187* -0.075 -0.161***
Nigeria 0.004 -- -0.076*** -0.059**
France 0.035 0.438 0.004 0.002
Australia 0.117** 0.335 0.093* 0.086*
Iran 0.036 -2.148*** -0.157*** -0.158***
Pakistan 0.014 0.006 -0.176*** -0.16***
Bangladesh -0.075 0.019 -0.325*** -0.304***
Other 0.024 0.238 0.048*** 0.063***
Model information
n 17660 1670 39590 48460
df 45 32 45 45
F 241.01*** 27.81*** 414.9*** 513.16***
R Square 0.3811 0.3523 0.3207 0.322
*p<0.05; ** p<0.01; *** p<0.001
Source: Wages and Salaries, 2017

71
Table 19: Linear regression for the log of employment income in 2017 for Express Entry principal
applicants – 2015 and 2016 cohorts
Factors
Model 1
coefficient
Model 2
coefficient
Constant 10.617*** 11.121***
Age group (ref. 20 to 29 years of age )
18 to 19 years of age 0.518 0.475
30 to 34 years of age 0.007 -0.003
35 to 39 years of age 0.059** -0.01
40 to 44 years of age 0.112*** 0.013
45 years of age or more 0.306*** 0.066*
Education (ref. Ph.D)
High school or less 0.233*** 0.008
One or two year post-secondary degree -0.158*** -0.05
Post-secondary program of 3 years or more or two or more post-secondary
program credentials
-0.037 -0.009
Master's degree or an entry-to-practice professional degree 0.095** 0.001
Knowledge of the first official language (ref. CLB 10 or more)
CLB 4-5 -0.799*** -0.218***
CLB 6 -0.802*** -0.259***
CLB 7 -0.715*** -0.263***
CLB 8 -0.445*** -0.141***
CLB 9 -0.146*** -0.053**
Knowledge of the second official language (ref. No)
Some proficiency at the CLB 5 level or more -0.035 -0.018
Canadian work experience (ref. No)
1 year 0.07 -0.111**
2 years 0.127** -0.068
3 years 0.176*** -0.077
4 years 0.217*** -0.136**
5 years or more 0.314*** -0.073
Presence of an accompanying spouse
45
(ref. No)
Has a spouse 0.145*** 0.057*
Accompanying spouse level of education (ref. Secondary school or less)
One or two year post-secondary degree -0.085 -0.041
Post-secondary program of 3 years or more or two or more post-secondary
program credentials
-0.072** -0.068**
Master's degree or Ph.D. -0.002 -0.006
Accompanying spouse official language proficiency (ref. No)
Some official language proficiency at the CLB 5 level or more -0.044* 0.005
Accompanying spouse Canadian work experience (ref. No)
Spouse has at least one year of Canadian work experience -0.077*** -0.046*
45
The presence of an accompanying spouse is not a factor considered in the CRS. Only human characteristics of the
accompanying spouse are considered in the CRS. The presence of an accompanying spouse was added to the analysis in order
to isolate the impact of having an accompanying spouse from the spousal human characteristics.

72
Factors
Model 1
coefficient
Model 2
coefficient
Post-secondary degree and good official language proficiency (ref. No
post-secondary degree or low OL proficiency)
Post-secondary degree of 1,2 or 3 years and lowest CLB is 7 to 8 0.087** 0.024
Post-secondary degree of 1, 2, or 3 years and lowest CLB is 9 or more -0.004 0.018
Two or more post-secondary degrees with at least one post-secondary degree of
3 years and lowest CLB is 7 to 8
0.03 0.057
Two or more post-secondary degrees with at least one post-secondary degree of
3 years and lowest CLB is 9 or more
-0.145** 0.037
Post-secondary degree and Canadian work experience (ref. No post-
secondary degree or no Canadian work experience)
Post-secondary degree of 1,2 or 3 years and 1 year of Canadian work
experience
0.21*** 0.033
Post-secondary degree of 1, 2, or 3 years and 2 years or more of Canadian work
experience
0.252*** 0.013
Two or more post-secondary degrees with at least one post-secondary degree of
3 years and one year of Canadian work experience
0.317*** 0.048
Two or more post-secondary degrees with at least one post-secondary degree of
3 years and 2 years or more of Canadian work experience
0.277*** -0.034
With good official language proficiency (ref. No foreign work experience or
low OL proficiency)
1 or 2 years of foreign work experience and lowest CLB is 7 to 8 0.033 -0.071*
1 or 2 years of foreign work experience and lowest CLB is 9 or more 0.004 -0.095**
3 or more years of foreign work experience and lowest CLB is 7 to 8 0.189*** 0.027
3 or more years of foreign work experience and lowest CLB is 9 or more 0.186*** 0.014
With Canadian work experience (ref. No foreign work experience or no
Canadian work experience)
1 or 2 years of foreign work experience and 1 year of Canadian work experience 0.023 0.106***
1 or 2 years of foreign work experience and 2 years or more of Canadian work
experience
0.032 0.074*
3 or more years of foreign work experience and 1 year of Canadian work
experience
0.106*** 0.049*
3 or more years of foreign work experience and 2 years or more of Canadian
work experience
0.172*** 0.031
Certificate of qualification (trade occupation) (ref. trade certificate with no
official language proficiency)
Trade certificate with some official language proficiency 0.253*** 0.073
Arranged employment (ref. No)
Has an arranged employment offer 0.203*** 0.096***
Provincial/Territorial Nomination (ref. No)
Has a provincial/territorial nomination 0.024 0.02
Year of admission (ref. 2015)
2016 -- -0.054***
Gender (ref. Female)
Male -- 0.207***

73
Factors
Model 1
coefficient
Model 2
coefficient
Intended province of destination (ref. Ontario)
Atlantic -- -0.092***
Manitoba and Saskatchewan -- -0.097***
Alberta -- -0.072***
British Columbia -- -0.045**
NOC skill level (ref. skill level A)
Skill level 0 -- -0.048*
Skill level B -- -0.136***
NOC skill type (ref. NOC 00)
Skill type 1 -- -0.584***
Skill type 2 -- -0.522***
Skill type 3 -- -0.692***
Skill type 4 -- -0.748***
Skill type 5 -- -0.637***
Skill type 6 -- -0.703***
Skill type 7 -- -0.656***
Skill type 8 -- -0.659***
Skill type 9 -- -0.537***
Amount of wages as a TR (ref. 0 / did not work in Canada prior to PR)
1$ to 24,999$ -- -0.051*
25,000$ to 49,999$ -- 0.203***
50,000$ to 74,999$ -- 0.549***
75,000$ to 99,999$ -- 0.767***
100,000$ or more -- 1.158***
Country of Citizenship (ref. India)
Philippines -- 0.159***
China -- -0.077***
United Kingdom -- 0.101***
Ireland -- 0.035
USA -- 0.212***
South Korea -- -0.146***
Nigeria -- -0.045
France -- 0.124**
Australia -- 0.097*
Iran -- -0.123*
Pakistan -- -0.12**
Bangladesh -- 0.008
Other -- 0.07***
Model information
n 19665 19600
df 45 80
F 88.77 137.04
R Square 0.169 0.359
*p<0.05; ** p<0.01; *** p<0.001
Source: Wages and Salaries, 2017

74
Table 20: Analysis of the unique contribution of predictors to the R-Square
Contribution of predictors Model 1 Model 2
R-square of the full model 0.1692 0.3597
Core human capital factors
Age 0.0046 0.0002
Education 0.0043 0.0001
Knowledge of the first official language 0.0319 0.0031
Knowledge of the second official language 0.00009 0
Canadian work experience 0.0017 0.0003
Accompanying spouse factors
Presence of an accompanying spouse
46
0.0038 0.0004
Accompanying spouse level of education 0.0005 0.0004
Accompanying spouse official language proficiency 0.0002 0
Accompanying spouse Canadian work experience 0.0005 0.0001
Skills transferability
Education and OL proficiency 0.0018 0
Education and Canadian work experience 0.0022 0.0003
Foreign work experience and OL proficiency 0.0031 0.0005
Foreign work experience and Canadian work experience 0.002 0.0004
Certificate of qualification 0.0017 0.0001
Additional points
Arranged employment 0.0034 0.0007
PT nomination 0.00009 0
Other socio-demographics
Year of admission -- 0.0007
Immigration Program -- 0.0001
Gender -- 0.0107
Intended province of destination -- 0.0005
NOC skill level of the intended occupation -- 0.0025
NOC skill type of the intended occupation -- 0.0107
Amount of TR wages as a TR -- 0.0902
Country of citizenship -- 0.0065
Note: As independent variables are often correlated and the shared variance between predictors is not reflected in the above table,
the sum of unique contributions to the R-square will not equal to the total R-squared value for the regression.
46
The presence of an accompanying spouse is not a factor considered in the CRS. Only human characteristics of the
accompanying spouse are considered in the CRS.

75
Table 21: Linear regression for the log of employment income at time of survey for Express Entry
principal applicants – 2015 to 2018 cohorts
Factors
Model 1
coefficient
Model 2
coefficient
Constant 10.883*** 11.172***
Age group (ref. 20 to 29 years of age )
18 to 19 years of age 0.138 0.494
30 to 34 years of age -0.032** 0.003
35 to 39 years of age 0.009 0.054***
40 to 44 years of age 0.072** 0.102***
45 years of age or more 0.115*** 0.122***
Education (ref. Ph.D)
High school or less -0.075 -0.118
One or two year post-secondary degree -0.348*** -0.182***
Post-secondary program of 3 years or more or two or more post-secondary
program credentials
-0.159*** -0.117***
Master's degree or an entry-to-practice professional degree -0.034 -0.056**
Knowledge of the first official language (ref. CLB 10 or more)
CLB 4-5 -0.579*** -0.382***
CLB 6 -0.548*** -0.349***
CLB 7 -0.422*** -0.31***
CLB 8 -0.259*** -0.18***
CLB 9 -0.141*** -0.105***
Knowledge of the second official language (ref. No)
Some proficiency at the CLB 5 level or more 0.033 0.005
Canadian work experience (ref. No)
1 year 0.134* 0.13*
2 years 0.15* 0.141*
3 years 0.157* 0.125
4 years 0.274*** 0.22**
5 years or more 0.207* 0.173*
Presence of an accompanying spouse (ref. No)
Has a spouse 0.108*** 0.074***
Accompanying spouse level of education (ref. Secondary school or
less)
One or two year post-secondary degree -0.132*** -0.099**
Post-secondary program of 3 years or more or two or more post-secondary
program credentials
0.005 -0.01
Master's degree or Ph.D 0.012 0
Accompanying spouse official language proficiency (ref. No)
Some official language proficiency at the CLB 5 level or more -0.024 -0.001
Accompanying spouse Canadian work experience (ref. No)
Spouse has at least one year of Canadian work experience -0.043 -0.018

76
Factors
Model 1
coefficient
Model 2
coefficient
Post-secondary degree and good official language proficiency (ref. No post-secondary degree or low OL
proficiency)
Post-secondary degree of 1,2 or 3 years and lowest CLB is 7 to 8 0.116* 0.062
Post-secondary degree of 1, 2, or 3 years and lowest CLB is 9 or more 0.047 0.02
Two or more post-secondary degrees with at least one post-secondary
degree of 3 years and lowest CLB is 7 to 8
0.043 0.019
Two or more post-secondary degrees with at least one post-secondary
degree of 3 years and lowest CLB is 9 or more
-0.087* -0.066
Post-secondary degree and Canadian work experience (ref. No post-secondary degree or no Canadian work
experience)
Post-secondary degree of 1,2 or 3 years and 1 year of Canadian work
experience
0.14* 0.026
Post-secondary degree of 1, 2, or 3 years and 2 years or more of Canadian
work experience
0.17* 0.022
Two or more post-secondary degrees with at least one post-secondary
degree of 3 years and one year of Canadian work experience
0.188** 0.081
Two or more post-secondary degrees with at least one post-secondary
degree of 3 years and 2 years or more of Canadian work experience
0.217*** 0.087
With good official language proficiency (ref. No foreign work experience or low OL proficiency)
1 or 2 years of foreign work experience and lowest CLB is 7 to 8 0.087* 0.017
1 or 2 years of foreign work experience and lowest CLB is 9 or more 0.104** 0.011
3 or more years of foreign work experience and lowest CLB is 7 to 8 0.178*** 0.07*
3 or more years of foreign work experience and lowest CLB is 9 or more 0.282*** 0.148***
With Canadian work experience (ref. No foreign work experience or no Canadian work experience)
1 or 2 years of foreign work experience and 1 year of Canadian work
experience
-0.065 0
1 or 2 years of foreign work experience and 2 years or more of Canadian
work experience
-0.053 0.019
3 or more years of foreign work experience and 1 year of Canadian work
experience
-0.025 0.01
3 or more years of foreign work experience and 2 years or more of
Canadian work experience
0.073* 0.096**
Certificate of qualification (trade occupation) (ref. trade certificate with
no official language proficiency)
Trade certificate with some official language proficiency 0.1* 0.075*
Arranged employment (ref. No)
Has an arranged employment offer - 50 points 0.22*** 0.206***
Has an arranged employment offer - 200 points 0.829*** 0.598***
Has an arranged employment offer - 600 points 0.328*** 0.299***
Education in Canada (ref. No)
1- or 2-year post-secondary credential -0.053** -0.025
3 year or more post-secondary credential 0.056*** 0.086
French-Speakers (ref. No)
Some French-Speaker points -0.172*** -0.129***
Siblings in Canada (ref. No)
Has siblings in Canada -0.1*** -0.034
Provincial/Territorial Nomination (ref. No)
Has a provincial/territorial nomination 0.052*** 0.03*

77
Factors
Model 1
coefficient
Model 2
coefficient
Year of admission (ref. 2015)
2016 -- 0.013
2017 -- -0.073**
2018 -- -0.132***
Gender (ref. Female)
Male -- 0.144***
Intended Province of Destination (ref. Ontario)
Atlantic -- -0.126***
Manitoba and Saskatchewan -- -0.14***
Alberta -- -0.042**
British Columbia -- 0.005
Territories -- 0.101
NOC skill level (ref. skill level A)
Skill level 0 -- -0.04**
Skill level B -- -0.178***
NOC skill type (ref. NOC 00)
Skill type 1 -- -0.221***
Skill type 2 -- -0.065
Skill type 3 -- -0.201***
Skill type 4 -- -0.414***
Skill type 5 -- -0.263***
Skill type 6 -- -0.378***
Skill type 7 -- -0.149**
Skill type 8 -- -0.33***
Skill type 9 -- -0.194**
Country of Citizenship (ref. India)
Philippines -- -0.239***
China -- 0.025
United Kingdom -- 0.151***
USA -- 0.204***
Nigeria -- -0.1***
France -- 0.086**
Iran -- -0.074*
Pakistan -- -0.052
Brazil -- 0.032
Other -- 0.007
Model information
n 17792 17792
df 51 81
F 52.618*** 68.61***
R Square 0.131 0.239
*p<0.05; ** p<0.01; *** p<0.001
Source: Survey of Economic Principal Applicants, 2019

78
Appendix E: Employer survey respondent profile
Overall, a total of 4,231 employers responded to the survey.
47
In terms of the profile of
employers who responded to the survey, results show that:
• nearly three-quarters of respondents (72%) reported that their organization was a small
business (5 to 99 employees) while 14% were medium-sized businesses (100 to 499
employees);
• over one-third of respondents (35%) indicated that their organization was located in Ontario,
while 18% reported that their organization was located in Alberta and 17% in British
Columbia; and
• over half of respondents (56%) were targeting occupations at the NOC B level as part of their
recruitment efforts, while 47% were targeting NOC C and 42% were targeting NOC D
occupations.
47
Although results from the survey of employers may serve as an indication of employers’ experiences with Job Bank, this survey
was exploratory in nature. As such, survey results are not meant to be representative of all Canadian employers who have used
Job Bank.

79
Appendix F: Regression results on employment income by
gender
Table 22: Linear regression for the log of employment income in 2017 for Express Entry and non-
Express Entry principal applicants by gender – 2015 and 2016 cohorts
Factors
Male
Model 1
coefficient
Male
Model 3
coefficient
Female
Model 1
coefficient
Female
Model 2
coefficient
Constant 10.634*** 10.938*** 10.557*** 10.935***
Express Entry (ref. No) 0.234*** 0.089*** 0.261*** 0.102***
Immigration Program (ref. FSW)
CEC -- -0.035*** -- -0.02
FST -- -0.013 -- -0.212
PNP -- -0.019 -- -0.007**
Year of admission (ref. 2015)
2016 -- -0.105*** -- -0.116***
Age group (ref. 45 years of age or more)
20 to 29 years of age -- -0.015 -- -0.023
30 to 34 years of age -- 0.02 -- -0.02
35 to 39 years of age -- 0.025 -- -0.002
40 to 44 years of age -- 0.021 -- 0.015
Education (ref. Ph.D)
Secondary or less -- -0.149*** -- -0.145***
Non-university studies (incl. trades) -- -0.187*** -- -0.166***
Bachelor's degree (incl. Post-grad no degree) -- -0.11*** -- -0.106***
Master's degree -- -0.073*** -- -0.079***
Mother tongue (ref. Other)
English or French -- 0.089*** -- 0.088***
Intended Province of Destination (ref. Ontario)
Atlantic -- -0.074*** -- -0.081***
Manitoba and Saskatchewan -- -0.129*** -- -0.157***
Alberta -- -0.102*** -- -0.101***
British Columbia -- -0.068*** -- -0.081***
NOC skill level (ref. skill level A)
Skill level 0 -- -0.026* -- -0.021
Skill level B -- -0.055*** -- -0.256***
NOC skill type (ref. NOC 00)
Skill type 1 -- -0.335*** -- -0.307***
Skill type 2 -- -0.183*** -- -0.157***
Skill type 3 -- -0.595*** -- -0.567***
Skill type 4 -- -0.56*** -- -0.543***
Skill type 5 -- -0.462*** -- -0.536***
Skill type 6 -- -0.472*** -- -0.515***
Skill type 7 -- -0.345*** -- -0.272**
Skill type 8 -- -0.354*** -- -0.197**
Skill type 9 -- -0.264*** -- -0.229***

80
Factors
Male
Model 1
coefficient
Male
Model 3
coefficient
Female
Model 1
coefficient
Female
Model 2
coefficient
Amount of wages as a TR (ref. 0 / did not work in Canada prior to PR)
1$ to 24,999$ -- -0.011 -- -0.008
25,000$ to 49,999$ -- 0.262*** -- 0.299***
50,000$ to 74,999$ -- 0.591*** -- 0.619***
75,000$ to 99,999$ -- 0.833*** -- 0.829***
100,000$ or more -- 1.268*** -- 1.294***
Country of Citizenship (ref. India)
Philippines -- 0.163*** -- 0.127***
China -- -0.137*** -- -0.121***
United Kingdom -- 0.147*** -- 0.136***
Ireland -- 0.002 -- -0.033
USA -- 0.222*** -- 0.248***
South Korea -- -0.171*** -- -0.146***
Nigeria -- -0.067** -- -0.08***
France -- 0.021 -- -0.014
Australia -- 0.079* -- 0.101**
Iran -- -0.192*** -- -0.181***
Pakistan -- -0.133*** -- -0.149***
Bangladesh -- -0.275*** -- -0.304***
Other -- 0.046*** -- 0.033**
Model information
n 56690 55955 44895 44195
df 1 47 1 47
F 801.49*** 497.83*** 683.38*** 437.75***
R Square 0.013 0.295 0.015 0.317
*p<0.05; ** p<0.01; *** p<0.001
Source: Wages and Salaries, 2017

81
Table 23: Linear regression for the log of employment income in 2017 for Express Entry principal
applicants by gender – 2015 and 2016 cohorts
Factors
Males -
model 1
coefficient
Males -
model 2
coefficient
Females -
model 1
coefficient
Females -
model 2
coefficient
Constant 10.692*** 11.462*** 10.541*** 10.748***
Age group (ref. 20 to 29 years of age )
18 to 19 years of age 0.602 0.591 0.508 0.334
30 to 34 years of age 0.045** 0.006 -0.036 -0.046*
35 to 39 years of age 0.091*** -0.02 0.033 -0.009
40 to 44 years of age 0.127*** -0.021 0.134** 0.08
45 years of age or more 0.309*** 0.027 0.225** 0.138*
Education (ref. Ph.D)
High school or less 0.209** -0.025 -0.359* -0.345*
One or two year post-secondary degree -0.154** -0.1* -0.108 0.029
Post-secondary program of 3 years or more or two
or more post-secondary program credentials
0.012 -0.022 -0.066 0.003
Master's degree or an entry-to-practice
professional degree
0.123** -0.024 0.049 0.028
Knowledge of the first official language (ref. CLB 10 or more)
CLB 4-5 -0.866*** -0.254*** -0.695*** -0.173*
CLB 6 -0.836*** -0.281*** -0.692*** -0.226***
CLB 7 -0.705*** -0.255*** -0.707*** -0.28***
CLB 8 -0.443*** -0.149*** -0.441*** -0.118*
CLB 9 -0.165*** -0.067** -0.128*** -0.027
Knowledge of the second official language (ref. No)
Some proficiency at the CLB 5 level or more 0.003 0.026 -0.046 -0.084
Canadian work experience (ref. No)
1 year 0.112* -0.124** 0.582*** 0.298*
2 years 0.174*** -0.071 0.596*** 0.308*
3 years 0.213*** -0.083 0.659*** 0.319*
4 years 0.237*** -0.142* 0.681*** 0.251
5 years or more 0.302*** -0.098 0.845*** 0.378*
Presence of an accompanying spouse (ref. No)
Has a spouse 0.169*** 0.106*** -0.126*** -0.107***
Accompanying spouse level of education (ref. Secondary school or less)
One or two year post-secondary degree -0.076 -0.058 -0.04 0.004
Post-secondary program of 3 years or more or two
or more post-secondary program credentials
-0.064* -0.042 -0.122* -0.122**
Master's degree or Ph.D -0.004 0.003 0.054 0.045
Accompanying spouse official language proficiency (ref. No)
Some official language proficiency at the CLB 5
level or more
-0.052* -0.016 0.073 0.072
Accompanying spouse Canadian work experience (ref. No)
Spouse has at least one year of Canadian work
experience
-0.032 -0.052* 0.062 0.013

82
Factors
Males -
model 1
coefficient
Males -
model 2
coefficient
Females -
model 1
coefficient
Females -
model 2
coefficient
Post-secondary degree and good official language proficiency (ref. no post-secondary degree or low OL
proficiency)
Post-secondary degree of 1,2 or 3 years and
lowest CLB is 7 to 8
0.055 -0.012 0.169** 0.082
Post-secondary degree of 1, 2, or 3 years and
lowest CLB is 9 or more
-0.028 -0.022 0.057 0.068
Two or more post-secondary degrees with at least
one post-secondary degree of 3 years and lowest
CLB is 7 to 8
0.038 0.081 -0.005 0.006
Two or more post-secondary degrees with at least
one post-secondary degree of 3 years and lowest
CLB is 9 or more
-0.138* 0.028 -0.131 0.044
Post-secondary degree and Canadian work experience (ref. No post-secondary degree or no Canadian
work experience)
Post-secondary degree of 1,2 or 3 years and 1
year of Canadian work experience
0.192*** 0.051 -0.381* -0.398**
Post-secondary degree of 1, 2, or 3 years and 2
years or more of Canadian work experience
0.191*** 0 -0.268 -0.349*
Two or more post-secondary degrees with at least
one post-secondary degree of 3 years and one
year of Canadian work experience
0.261*** 0.034 -0.205 -0.322*
Two or more post-secondary degrees with at least
one post-secondary degree of 3 years and 2 years
or more of Canadian work experience
0.189*** -0.07 -0.156 -0.35*
With good official language proficiency (ref. No foreign work experience or low OL proficiency)
1 or 2 years of foreign work experience and lowest
CLB is 7 to 8
0.048 -0.034 -0.014 -0.128*
1 or 2 years of foreign work experience and lowest
CLB is 9 or more
0.01 -0.063 -0.014 -0.125*
3 or more years of foreign work experience and
lowest CLB is 7 to 8
0.192*** 0.034 0.149** 0.017
3 or more years of foreign work experience and
lowest CLB is 9 or more
0.194*** 0.031 0.164** 0.013
With Canadian work experience (ref. No foreign work experience or no Canadian work experience)
1 or 2 years of foreign work experience and 1 year
of Canadian work experience
0.002 0.075* 0.053 0.149**
1 or 2 years of foreign work experience and 2
years or more of Canadian work experience
0.038 0.067 0.009 0.08
3 or more years of foreign work experience and 1
year of Canadian work experience
0.084** 0.038 0.098* 0.059
3 or more years of foreign work experience and 2
years or more of Canadian work experience
0.128*** 0.009 0.143** 0.07
Certificate of qualification (trade occupation) (ref. trade certificate with no official language proficiency)
Trade certificate with some official language
proficiency
0.199*** 0.074 -0.183 -0.004
Arranged employment (ref. No)
Has an arranged employment offer 0.207*** 0.1*** 0.157*** 0.095*
Provincial/Territorial Nomination (ref. No)
Has a provincial/territorial nomination 0.028 0.024 -0.009 0.01

83
Factors
Males -
model 1
coefficient
Males -
model 2
coefficient
Females -
model 1
coefficient
Females -
model 2
coefficient
Year of admission (ref. 2015)
2016 -- -0.062*** -- -0.036
Intended Province of Destination (ref. Ontario)
Atlantic -- -0.049 -- -0.174***
Manitoba and Saskatchewan -- -0.094** -- -0.154*
Alberta -- -0.062*** -- -0.107***
British Columbia -- -0.034* -- -0.069*
NOC skill level (ref. skill level A)
Skill level 0 -- -0.05* -- -0.051
Skill level B -- -0.123*** -- -0.172***
NOC skill type (ref. NOC 00)
Skill type 1 -- -0.696*** -- -0.229
Skill type 2 -- -0.601*** -- -0.202
Skill type 3 -- -0.801*** -- -0.332*
Skill type 4 -- -0.873*** -- -0.374**
Skill type 5 -- -0.69*** -- -0.357**
Skill type 6 -- -0.76*** -- -0.386**
Skill type 7 -- -0.73*** -- -0.361*
Skill type 8 -- -0.725*** -- -0.392*
Skill type 9 -- -0.6*** -- -0.281
Amount of wages as a TR (ref. 0 / did not work in Canada prior to PR)
1$ to 24,999$ -- -0.082** -- 0.005
25,000$ to 49,999$ -- 0.158*** -- 0.267***
50,000$ to 74,999$ -- 0.503*** -- 0.641***
75,000$ to 99,999$ -- 0.738*** -- 0.824***
100,000$ or more -- 1.144*** -- 1.148***
Country of Citizenship (ref. India)
Philippines -- 0.188*** -- 0.165***
China -- -0.088** -- -0.094**
United Kingdom -- 0.101*** -- 0.071
Ireland -- 0.023 -- 0.05
USA -- 0.24*** -- 0.15*
South Korea -- -0.151*** -- -0.151**
Nigeria -- -0.067 -- 0.003
France -- 0.064 -- 0.175**
Australia -- 0.081 -- 0.109
Iran -- -0.122* -- -0.129
Pakistan -- -0.122** -- -0.142
Bangladesh -- -0.007 -- 0.025
Other -- 0.061*** -- 0.073*
Model information
n 13290 13250 6370 6350
df 45 79 45 79
F 69.94*** 99.73*** 23.02*** 29.03***
R Square 0.192 0.374 0.14 0.267
*p<0.05; ** p<0.01; *** p<0.001
Source: Wages and Salaries, 2017

84
Appendix G: Case studies
To better understand issues of labour market shortages or oversupply and how Express Entry may
contribute to addressing them, the evaluation conducted four case studies on specific occupations:
pharmacists, Information and Communications Technology (ICT) occupations, chefs and cooks,
and food services.
Table 24 presents information on labour market demand outlook at the national and provincial
level, and administrative data on EE admissions of PAs in each occupational area.
Table 24: Labour market outlook and Express Entry principal applicant admissions – selected
occupations
Occupations
Labour Market
Demand Outlook
– National
Labour Market Demand
Outlook - Provincial
EE PA Admissions
(2015-2018) -
National
EE PA Admissions -
Provincial
Pharmacists Balanced (2017-
2026)
In demand in Ontario,
Alberta and British
Columbia
555 admissions Ontario: 50%
Alberta: 27%
British Columbia: 14%
ICT
occupations
In demand (2017-
2021)
Most in demand in Ontario,
British Columbia, Alberta
31,382 admissions Ontario: 65%
British Columbia: 19%
Alberta: 5%
Chefs and
Cooks
Balanced for
chefs, surplus for
cooks (2017-
2026)
In demand in Alberta,
Saskatchewan, Manitoba,
New Brunswick and Nova
Scotia
3,474 admissions Alberta: 50%
British Columbia: 25%
Ontario: 18%
Food services Balanced (2017-
2026)
In demand in
Saskatchewan, Manitoba,
Alberta, British Columbia,
Nova Scotia and New
Brunswick
5,293 admissions Alberta: 42%
Ontario: 27%
British Columbia: 25%
Source: GCMS, COPS, and provincial labour market reports.
Information and communications technology occupations
According to the Information and Communications Technology Council (ICTC), a considerable
number of jobs will be created in the ICT sector between 2017 and 2021. Nearly two-thirds of all
employment growth during this period will occur in Ontario (63%) while approximately 15% of
growth will occur in British Columbia and 12% in Alberta. Further, in a 2017 report, the ICTC
noted that the ICT sector is facing labour shortages resulting from a number of socio-
demographic challenges, such as an aging population, low birth rates and increasing numbers of
retiring baby boomers.
Administrative data on admissions indicates that 31,382 EE PAs have been admitted between
2015 and 2018, with numbers of admissions increasing each year. Most PAs (89%) were
intending to settle where the labour demand for ICT occupations was highest, that is in Ontario
(65%), British Columbia (19%) and Alberta (5%).
Food services
At the national level, Canadian Occupational Projection System (COPS) occupational forecasts
indicate that the labour demand and supply for occupations in the food services sector, including
restaurant and food service managers and food service supervisors, will be in balance for the
period 2017 to 2026. However, at the provincial level, several governments, such as

85
Saskatchewan, Manitoba, Alberta, British Columbia, Nova Scotia and New Brunswick, have
identified these occupations as being high in demand over the short-, medium- and/or longer
terms.
Between 2015 and 2018, a total of 5,030 PAs were admitted who intended to work in food
service occupations (NOC 0 and B), 94% of which were intending to settle in Alberta (42%),
Ontario (27%) and British Columbia (25%).
Chefs and cooks
At the national level, the COPS occupational outlooks for chefs indicates that labour demand and
labour supply would be balanced for the period 2017 to 2026 while a surplus is expected for
cooks during this period. On the other hand, some provinces have highlighted chefs and cooks as
in-demand occupations in their respective jurisdictions, including Alberta, Saskatchewan,
Manitoba, New Brunswick and Nova Scotia.
A total of 3,474 EE PAs were admitted with the intention of being a chef or a cook, with 95%
intending to settle either in Alberta (50%), British Columbia (25%), or Ontario (18%). An
analysis of administrative data revealed that 80% of chefs/cooks admitted through EE had
received points for a pre-arranged offer of employment. Further, while chefs/cooks represented
3% of all candidates admitted through EE between 2015 and 2018, this group represented 11% of
all candidates who received points for a pre-arranged offer of employment during this period.
In November 2016, CRS points allocated for a pre-arranged offer of employment were reduced
from 600 to 50 points for job offers in NOC 0, A and B occupations. Following the change, the
number of chefs/cooks admitted through EE decreased by approximately 31%. The number of
chefs/cooks admitted dropped from 949 in 2017 to 659 in 2018.
Pharmacists
For pharmacists, the COPS occupational outlook at the national level indicates that labour
demand and labour supply would be balanced for the period 2017 to 2026, meaning that
projected job seekers would be sufficient to fill projected job openings.
However, labour market reports differ at the provincial level. The three provinces with the largest
supply of pharmacists, Ontario, Alberta and British Columbia, have all identified pharmacists as
an in-demand occupation. In British Columbia, for example, a significant number of job openings
are expected over the next 10 years as a result of job creation and the need to replace retiring
workers.
Administrative data shows that EE has contributed modestly to increasing the supply of
pharmacists between 2015 and 2018, with 555 PAs who had identified pharmacists as their
intended occupation. Aligning with the demand forecast at the provincial level, the majority
(91%) of EE pharmacists admitted intended to settle in Ontario (50%), Alberta (27%) or British
Columbia (14%).
